U.S. federal electricity regulators have scheduled technical conferences for this autumn to discuss issues related to two major policy initiatives: carbon pricing in organized wholesale electricity markets, and offshore wind integration in regional transmission organizations and independent system operators (RTOs/ISOs). The Federal Energy Regulatory Commission's scheduling of two technical conferences on these topics signals its interest in exploring the interplay between state energy and environmental policies and federally jurisdictional markets.
One technical conference regarding Carbon Pricing in Organized Wholesale Electricity Markets (Docket No. AD20-14-000)
will be held on September 30, 2020, "to discuss considerations related
to state adoption of mechanisms to price carbon dioxide emissions,
commonly referred to as carbon pricing, in regions with
Commission-jurisdictional organized wholesale electricity markets." The case has its genesis in a request for such an event, filed on April 13, 2020, by a broad coalition including Advanced Energy Economy, the American Council on Renewable Energy, the American Wind Energy Association, Brookfield Renewable, Calpine Corporation, Competitive Power Ventures, Inc., the Electric Power Supply Association, the Independent Power Producers of New York, Inc., LS Power Associates, L.P., the Natural Gas Supply Association, NextEra Energy, Inc., PJM Power Providers Group, R Street Institute, and Vistra Energy Corp. A number of other utilities, RTOs, and state interests also expressed support, prior to the Commission's issuance of a public notice on June 17 scheduling the event.
Another technical conference regarding Offshore Wind Integration in RTOs/ISOs (Docket No. AD20-18-000), to be held October 27, 2020, will be convened "to discuss whether existing Commission transmission, interconnection, and merchant transmission facility frameworks in RTOs/ISOs can accommodate anticipated growth in offshore wind generation in an efficient and effective manner that safeguards open access transmission principles and to consider possible changes or improvements to the current framework should they be needed to accommodate such growth."
Beyond the fact that the Commission issued notices of both technical conferences on June 17, 2020, the proceedings also share a common focus on the effects of state energy and environmental policies on federally-jurisdictional activities. For now, the prevailing carbon pricing mechanisms -- such as the Regional Greenhouse Gas Initiative adopted by many northeastern states -- and the strongest policies favoring or requiring offshore wind development are arising as a matter of state law and policy, as opposed to federal law.
The boundaries between federal and state jurisdiction are viewed by many as long-settled, although a series of federal court and agency decisions have found specific state electricity procurement and subsidy laws to be preempted by federal regulation, and a case pending before the Commission asks it to find that most state net metering programs are preempted by federal law. Whether the Commission grants or denies the pending request, the June 17 notices of technical conferences on carbon pricing and offshore wind integration suggest continued federal interest in exploring the implications of state policies on FERC-jurisdictional markets.

Energy powers society; society's choices shape energy policy. A blog about our energy resources and the choices they present for society.
Showing posts with label price. Show all posts
Showing posts with label price. Show all posts
EIA says 2016 U.S. energy expenditures declined to lowest share of GDP since 1970
Thursday, January 24, 2019
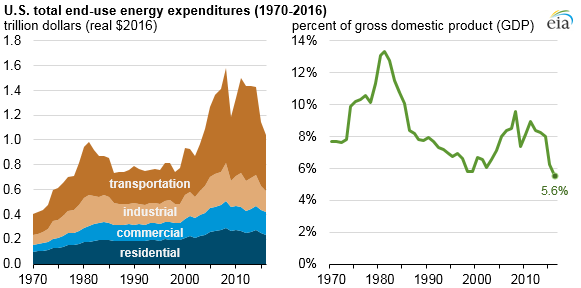
According to the most recent data released by the U.S. Energy Information Administration, in 2016, U.S. energy expenditures declined for the fifth consecutive year, reaching $1.0 trillion in 2016. This represents a 9% decrease in real terms from 2015.
Adjusted for inflation, total energy expenditures in 2016 were the lowest since 2003. Expressed as a percent of gross domestic product (GDP), total energy expenditures were 5.6% in 2016, the lowest share of GDP since at least 1970. According to EIA, contributing factors include steady annual increases in GDP since 2010, coupled with steady annual decreases in total energy expenditures since 2011.
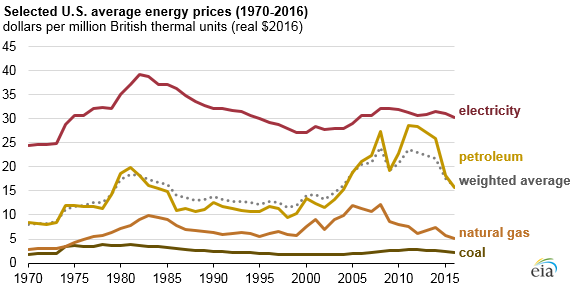
Meanwhile, annual total U.S. energy consumption has remained virtually flat since 2013. So the recent decreases in total energy expenditures are generally the result of lower energy prices. But EIA says it doesn’t expect this trend to continue, as average energy prices of products such as motor gasoline, natural gas, and retail electricity have all increased since 2016.
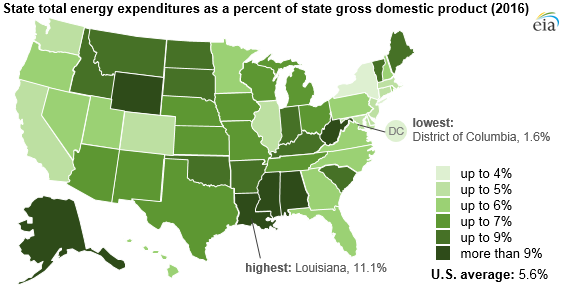
EIA also notes significant geographic variation in state total energy expenditures as a percent of state GDP. In 2016, Louisiana led the pack as it has every year since EIA started tracking this metric in 1997, with 2016 energy expenditures per GDP of 11.1% in 2016. EIA points to Louisiana’s large industrial sector consumption, including its energy-intensive petrochemical industry, as the biggest piece of the explanation.
But even while leading the nation, Louisiana set its own record-low ratio of energy expenditures per GDP, at a level that was less than half of the state’s previous high (26.5%) which was reached in 2008. Meanwhile, District of Columbia (1.6%), New York (3.3%), Massachusetts (4.3%), California (4.3%), and Delaware (4.4%) had the lowest energy expenditures per GDP in 2016. EIA says this reflects relatively high consumption in less energy-intensive residential and commercial sectors as well as relatively high state GDP.
Adjusted for inflation, total energy expenditures in 2016 were the lowest since 2003. Expressed as a percent of gross domestic product (GDP), total energy expenditures were 5.6% in 2016, the lowest share of GDP since at least 1970. According to EIA, contributing factors include steady annual increases in GDP since 2010, coupled with steady annual decreases in total energy expenditures since 2011.
 | ||
| Source: EIA, "In 2016, U.S. energy expenditures per unit GDP were the lowest since at least 1970" |
 |
| Source: EIA, "In 2016, U.S. energy expenditures per unit GDP were the lowest since at least 1970" |
 |
| Source: EIA, "In 2016, U.S. energy expenditures per unit GDP were the lowest since at least 1970" |
But even while leading the nation, Louisiana set its own record-low ratio of energy expenditures per GDP, at a level that was less than half of the state’s previous high (26.5%) which was reached in 2008. Meanwhile, District of Columbia (1.6%), New York (3.3%), Massachusetts (4.3%), California (4.3%), and Delaware (4.4%) had the lowest energy expenditures per GDP in 2016. EIA says this reflects relatively high consumption in less energy-intensive residential and commercial sectors as well as relatively high state GDP.
ISONE External Market Monitor report 2015
Monday, July 11, 2016
A report by the New England electricity market's external monitor has found that "the markets performed competitively in 2015."
ISO New England operates wholesale electricity markets covering most of New England. It employs two independent market monitors -- one internal to ISO-NE, one a hired external consultant -- to regularly review, analyze, and report on market results, and offer recommendations on market improvements.
Potomac Economics serves as the External Market Monitor for ISO-NE. In this role, it is charged with evaluating the competitive performance, design, and operation of the wholesale electricity markets operated by ISO-NE. Last month, the external market monitor released its "2015 Assessment of the ISO New England Electricity Markets" (102-page PDF), presenting its perspective on the New England electricity markets.
Among other findings, the report notes that energy market trends "have been dominated by reductions in fuel prices over the last two years. In particular, from 2014 to 2015:
ISO New England's internal market monitor released its 2015 Annual Markets Report earlier this year. That report similarly found that overall, "the ISO New England capacity, energy, and ancillary service markets performed well in 2015."
ISO New England operates wholesale electricity markets covering most of New England. It employs two independent market monitors -- one internal to ISO-NE, one a hired external consultant -- to regularly review, analyze, and report on market results, and offer recommendations on market improvements.
Potomac Economics serves as the External Market Monitor for ISO-NE. In this role, it is charged with evaluating the competitive performance, design, and operation of the wholesale electricity markets operated by ISO-NE. Last month, the external market monitor released its "2015 Assessment of the ISO New England Electricity Markets" (102-page PDF), presenting its perspective on the New England electricity markets.
Among other findings, the report notes that energy market trends "have been dominated by reductions in fuel prices over the last two years. In particular, from 2014 to 2015:
- Natural gas prices declined more than 40 percent, falling to multi -year lows in mid -2015 largely because of higher shale production from the Marcellus and Utica regions; and
- Fuel oil prices fell by more than 35 percent because of increased global supply, and world liquefied natural gas (LNG) prices have fallen similarly. These reductions helped limit the increase in natural gas prices during tight gas supply conditions in the winter.
ISO New England's internal market monitor released its 2015 Annual Markets Report earlier this year. That report similarly found that overall, "the ISO New England capacity, energy, and ancillary service markets performed well in 2015."
Record low prices in summer 2015 New England wholesale electricity market
Tuesday, November 3, 2015
The summer of 2015 brought New England the lowest wholesale
electricity prices since 2003, thanks to record low prices for natural
gas. According to regional grid operator ISO New England Inc., this
illustrates what happens "when New England power plants can access the
vast supply
of lower-priced, domestic natural gas being produced in the Marcellus
shale deposit."
In a post on its ISO Newswire site, the grid operator noted that the average real-time wholesale electricity price for June, July, and August 2015 was $26.86 per megawatt-hour (MWh). By comparison, the average real-time price of wholesale electric energy in 2014 was $63.32 per megawatt-hour. While summer energy prices have typically averaged lower than winter prices in New England, 2015's summer prices were low even in comparison to other recent summers: $34.31 in 2014, or $43.94 in 2013.
What explains New England's low wholesale electricity prices this summer? According to ISO New England, it's because existing natural gas-fired power plants could get fuel at a low price:
New England's average summer electricity price was even below that of other regions, like the Midwest. According to ISO-NE, "This summer’s prices indicate that the region’s electricity prices can be competitive, in the more commonly understood sense, with other regions of the US when low-cost fuel is available." Indeed, at times the price of natural gas in New England was below that of the benchmark Henry Hub.
The post also describes how heavy winter demand for natural gas for both heating and power generation, combined with pipeline constraints, yields high natural gas prices and thus high electricity prices. This has occurred repeatedly in recent winters, such as in January and February 2014 and February 2015. What is at issue is thus the ability of the interstate natural gas pipeline transportation network to ship enough gas into the Northeast -- a capability exceeded through much of the recent winters, with the resulting price paid in coal and oil emissions as well as dollars.
As ISO-NE notes, most customers' retail rates for electricity are set using mechanisms to reduce rate volatility, and time of use rates are not yet widely adopted. But the net movement of wholesale markets is eventually priced into retail rates. Can New England keep competitive with other regions?
 |
| ISO-NE, "Summer 2015: The lowest natural gas and power prices since 2003" |
In a post on its ISO Newswire site, the grid operator noted that the average real-time wholesale electricity price for June, July, and August 2015 was $26.86 per megawatt-hour (MWh). By comparison, the average real-time price of wholesale electric energy in 2014 was $63.32 per megawatt-hour. While summer energy prices have typically averaged lower than winter prices in New England, 2015's summer prices were low even in comparison to other recent summers: $34.31 in 2014, or $43.94 in 2013.
What explains New England's low wholesale electricity prices this summer? According to ISO New England, it's because existing natural gas-fired power plants could get fuel at a low price:
In essence, the reason was the low price of natural gas that could be delivered to the power plants that burn natural gas to make electricity. For most of the year, the price of natural gas is low in New England, and as a consequence, the demand for natural gas for both heating and power generation just continues to grow. In fact, in 2014, New England power generators using natural gas produced 44% of the region’s electricity.The ISO-NE post describes how low-priced natural gas plus adequate interstate pipeline transportation capacity yields New England low electricity prices. Indeed, the average price of natural gas in New England during June, July, and August averaged a record low $2/MMBtu. This is nearly 40% below last year's summer average ($3.27/MMBtu), itself the next-lowest summer record.
New England's average summer electricity price was even below that of other regions, like the Midwest. According to ISO-NE, "This summer’s prices indicate that the region’s electricity prices can be competitive, in the more commonly understood sense, with other regions of the US when low-cost fuel is available." Indeed, at times the price of natural gas in New England was below that of the benchmark Henry Hub.
The post also describes how heavy winter demand for natural gas for both heating and power generation, combined with pipeline constraints, yields high natural gas prices and thus high electricity prices. This has occurred repeatedly in recent winters, such as in January and February 2014 and February 2015. What is at issue is thus the ability of the interstate natural gas pipeline transportation network to ship enough gas into the Northeast -- a capability exceeded through much of the recent winters, with the resulting price paid in coal and oil emissions as well as dollars.
As ISO-NE notes, most customers' retail rates for electricity are set using mechanisms to reduce rate volatility, and time of use rates are not yet widely adopted. But the net movement of wholesale markets is eventually priced into retail rates. Can New England keep competitive with other regions?
FERC 2014 State of the Markets report
Monday, March 23, 2015
U.S. energy markets overseen by the Federal Energy Regulatory Commission in 2014 were impacted by extreme weather and changes in the mix of electric generation resources, according to a report by Commission staff.
The 2014 State of the Markets report issued on March 19 by FERC's Office of Enforcement’s Division of Energy Market Oversight presents Commission's staff’s assessment of recent developments in natural gas, electric, and other energy markets.
Extreme cold temperatures in the first quarter of 2014 affected natural gas infrastructure and power markets across the country. The price of natural gas in the U.S. reached record high levels, driving corresponding spikes in the price of electricity. For example, the price of natural gas at the Transco Zone 6 Non-NY pricing point hit $123/MMBtu in January -- about 33 times higher than the average 2013 U.S. price. Largely due to these price spikes, the spot natural gas price at the Henry Hub pricing point averaged $4.32/MMBtu in 2014, a 16% increase over 2013.
Meanwhile, natural gas and renewable resources continued to displace coal as a fuel for electric power generation. Total U.S. generating capacity increased 10.8 GW in 2014, with natural gas and renewable projects representing the bulk of new capacity. At the same time, utilities retired coal-fired power plants, continuing a trend that started in 2012. Commission staff projects continued coal retirements in 2015, particularly after the April effective date of additional air emissions regulations imposed by the Environmental Protection Agency's Mercury and Air Toxics Standards.
FERC's 2014 State of the Markets report also provides a quick look at 2015 year-to-date market performance. Wholesale electricity prices rose again this winter, although not as sharply as in the first quarter of 2014. FERC staff's report suggests factors helping to moderate winter prices included better cold-weather preparation of assets, programs like ISO New England's Winter Reliability Program, better coordination between operators of electric transmission and natural gas pipelines, record high levels of natural gas production, the development of new pipeline infrastructure, and low oil prices.
Polar vortex caused energy price spikes, says FERC staff
Monday, October 20, 2014
Why did energy prices rise during last winter's extremely cold "polar vortex" weather? A recent report by federal regulators suggests that inadequate infrastructure is largely to blame, while finding no evidence of widespread or sustained market manipulation.
The 2013 - 2014 winter season brought prolonged and unusually cold weather events in much of the United States. While the nation's major electric grids were generally able to maintain reliable operation, prices for natural gas and electricity spiked to unprecedented levels. Bottlenecks on interstate natural gas pipelines limited the amount of gas flowing into regions like the Northeast, while demand for gas for heating and electric power generation increased beyond the constrained pipelines' capacity. This imbalance of supply and demand for gas led to extremely high prices for gas as well as for electricity, because the price of natural gas often sets the price for power. Compounding the problem, some generators could not buy enough gas to operate, while others experienced outages due to equipment failure and frozen coal piles. In some regions, generators amounting to 30 percent of electric load faced forced outages.
As an immediate response, the Federal Energy Regulatory Commission took actions including changes to rules in the PJM, New York ISO and California ISO electricity markets, the Commission's first use of its emergency powers under the Interstate Commerce Act to direct Enterprise TE Products Pipeline to temporarily provide priority treatment to certain propane shipments, and approving a Winter Reliability Program in the ISO New England region.
According to a recently released report by the staff of the Federal Energy Regulatory Commission, the FERC Office of Enforcement also launched investigations into whether market participant behavior influenced regulated energy prices. In addition to the Commission's enforcement arm's regular surveillance of natural gas and electric markets for market manipulation and other improper conduct, the past winter's extreme price spikes prompted a closer look by the Office of Enforcement to determine if market manipulation was behind the historically high natural gas and electric prices.
On October 16, FERC’s enforcement staff reported that it found "no evidence of widespread or sustained market manipulation." Enforcement staff said it reached its conclusions after an extensive review and data analysis related to gas trading behavior, allegations received through the FERC hotline, generator offer behavior and outage behavior.
However, enforcement staff reported that three non-public investigations remain pending. At stake is whether any market participant was involved with the formation of a single monthly natural gas index to benefit its financial derivative positions, as well as whether certain generators improperly took advantage of constrained conditions in the electric markets by bidding in a way that increased their uplift payments.
Expect these enforcement investigations to continue, either to an informal resolution or a public enforcement process. With former Office of Enforcement head Norman Bay as the newest FERC Commissioner, FERC's enforcement arm appears to be growing in influence. Meanwhile, the coming winter may yet again test the nation's electricity and natural gas infrastructure. What will the 2014 - 2015 winter hold, in terms of energy reliability, pricing, and enforcement actions?
 |
| A recent winter in New England: cold ocean, cold snow. Must high energy prices follow? |
The 2013 - 2014 winter season brought prolonged and unusually cold weather events in much of the United States. While the nation's major electric grids were generally able to maintain reliable operation, prices for natural gas and electricity spiked to unprecedented levels. Bottlenecks on interstate natural gas pipelines limited the amount of gas flowing into regions like the Northeast, while demand for gas for heating and electric power generation increased beyond the constrained pipelines' capacity. This imbalance of supply and demand for gas led to extremely high prices for gas as well as for electricity, because the price of natural gas often sets the price for power. Compounding the problem, some generators could not buy enough gas to operate, while others experienced outages due to equipment failure and frozen coal piles. In some regions, generators amounting to 30 percent of electric load faced forced outages.
As an immediate response, the Federal Energy Regulatory Commission took actions including changes to rules in the PJM, New York ISO and California ISO electricity markets, the Commission's first use of its emergency powers under the Interstate Commerce Act to direct Enterprise TE Products Pipeline to temporarily provide priority treatment to certain propane shipments, and approving a Winter Reliability Program in the ISO New England region.
According to a recently released report by the staff of the Federal Energy Regulatory Commission, the FERC Office of Enforcement also launched investigations into whether market participant behavior influenced regulated energy prices. In addition to the Commission's enforcement arm's regular surveillance of natural gas and electric markets for market manipulation and other improper conduct, the past winter's extreme price spikes prompted a closer look by the Office of Enforcement to determine if market manipulation was behind the historically high natural gas and electric prices.
On October 16, FERC’s enforcement staff reported that it found "no evidence of widespread or sustained market manipulation." Enforcement staff said it reached its conclusions after an extensive review and data analysis related to gas trading behavior, allegations received through the FERC hotline, generator offer behavior and outage behavior.
However, enforcement staff reported that three non-public investigations remain pending. At stake is whether any market participant was involved with the formation of a single monthly natural gas index to benefit its financial derivative positions, as well as whether certain generators improperly took advantage of constrained conditions in the electric markets by bidding in a way that increased their uplift payments.
Expect these enforcement investigations to continue, either to an informal resolution or a public enforcement process. With former Office of Enforcement head Norman Bay as the newest FERC Commissioner, FERC's enforcement arm appears to be growing in influence. Meanwhile, the coming winter may yet again test the nation's electricity and natural gas infrastructure. What will the 2014 - 2015 winter hold, in terms of energy reliability, pricing, and enforcement actions?
US energy consumers paid $14 billion more last winter
Tuesday, May 27, 2014
U.S. consumers paid $14 billion more for their energy needs during the winter of 2013-2014 compared to the previous winter, according to a report by the U.S. Energy Information Administration.
The cost of energy affects people and businesses across the country. Consumers are affected by both the price they pay per unit of electricity or fuel for transportation and heating and the volume of each energy commodity they demand. In much of the U.S., demand for energy increases during winter months. The winter season often sees prices increase as well, as more expensive supply is needed to meet consumer demand.
The winter of 2013-2014 was no exception, according to the EIA's data. U.S. consumers spent $14 billion more for energy during the fourth quarter of 2013 and first quarter of 2014 compared to the previous winter. This amounts to an increase of 4.4%, or a 0.1% increase when measured as a share of disposable income.
The biggest drivers of the increase in consumer energy costs were higher expenditures for electricity, natural gas, heating oil and propane. Electricity expenditures increased $7.9 billion, or 10%, last winter compared with the previous winter. Much of the increased cost of electricity came as a result of increased costs for natural gas, a key fuel used for electric power generation. Constraints on interstate natural gas pipelines drive fuel prices up as demand increases. Throughout much of the northeast region, interstate natural gas pipelines reach their maximum flow rates on an increasing number of winter days. When the pipelines begin to fill, the price of natural gas delivered into the constrained region increases. Ultimately, when the pipelines have reached their maximum capacity, no more natural gas can be bought at any price.
The price of natural gas also affects consumers directly, as consumers also rely upon natural gas for space heating and applications like drying. EIA's data show that consumer expenditures for natural gas increased by $5.8 billion, or 16%, last winter compared with the previous winter.
Expenditures for the other major heating fuels -- oil and propane -- also increased by $6.0 billion, or 27%, over the previous winter. As EIA notes, heating oil and propane are used predominantly for space heating and are used to heat a relatively small number of homes, but their use is concentrated in the Northeast -- the area of the country that experienced the coldest weather this winter. Propane consumers experienced not only price spikes but even shortages during the coldest parts of the season.
As costly as the past winter was, the increase in consumer energy costs would have been even higher if transportation-related costs had not decreased significantly. In fact, transportation accounts for the largest single share of U.S. consumers' energy budget -- often over two-thirds of energy expenditures during the summer driving season, and over half of energy expenditures even in the winter. But transportation fuel expenses decreased by $5.8 billion, or 3%, last winter compared with the previous winter. EIA cites reductions in demand for gasoline due to winter storms that reduced driving.
Weather is a significant factor affecting winter energy costs -- but policies and infrastructure also play major roles in shaping consumers' energy expenditures. What will next winter bring?
Feds release June 2013 short-term energy outlook
Thursday, June 13, 2013
The U.S. Energy Information Administration has released its updated short-term energy outlook. The report describes recent trends in fuel and energy resource markets, and predicts future supply, demand, and prices. Highlights from the June 2013 report include:
EIA's projections are based on a variety of assumptions about the domestic and global economies, energy project development, and weather-related demand for energy products. EIA's next short-term energy outlook will be released on July 9, 2013.
- Gasoline prices to decrease: EIA predicts that the price of regular gasoline will average $3.53 per gallon over the summer driving season. Noting a decrease from 2012's annual average retail price of $3.63 per gallon, EIA predicts that gasoline will continue to decline in price to $3.49 per gallon in 2013 and to $3.37 per gallon in 2014. That said, EIA notes significant uncertainty about this forecast based in part on current values of futures and options contracts.
- Crude oil prices to decrease: EIA predicts similar decreases in the price of crude oil through 2014. Through much of the world, oil commodity pricing is based on the Brent crude price -- the price paid for a sweet light crude oil produced from Europe's North Sea fields. Spot pricing for Brent crude bounced around in the first 5 months of 2012, ranging from a low of $97 per barrel in April to a high of $119 per barrel in February. EIA expects a slow decrease in the Brent crude oil spot price, averaging $102 per barrel over the second half of 2013, and $100 per barrel in 2014.
- Electricity usage to decrease while prices increase: EIA's forecasts call for milder temperatures than last summer, driving air conditioning-related demand for electricity downward. At the same time, EIA expects a 2% increase in average prices for delivered electricity this summer. Last year, the U.S. residential electricity price averaged 11.9 cents per kWh. EIA expects this summer's average price to rise to 12.3 cents/kWh, with a 1.1 percent price increase in 2013 and a 1.9 percent in 2014.
EIA's projections are based on a variety of assumptions about the domestic and global economies, energy project development, and weather-related demand for energy products. EIA's next short-term energy outlook will be released on July 9, 2013.
Report: northeastern demand drives natural gas pipeline growth
Monday, March 25, 2013
A federal energy agency has highlighted the demand for natural gas in the northeastern United States. The U.S. Energy Information Administration's report shows that over half of U.S. natural gas pipeline projects installed in 2012 were in the Northeast region. Low-cost gas produced from the Marcellus shale formation, combined with increased demand for gas in the Northeast, are driving pipeline expansion - but significant bottlenecks remain, keeping New England's natural gas prices higher and more volatile than those in the rest of the country.
For the past several years, natural gas pipeline capacity in the U.S. has grown. According to EIA, overall investment in domestic natural gas pipeline capacity slowed in 2012, but the northeast United States was home to the majority of growth. Other than facilities for gathering, storing, and distributing natural gas, natural gas pipeline capacity expansions totaled $1.8 billion in capital expenditures in 2012, adding 4.5 billion cubic feet per day of new pipeline capacity and 367 miles of pipe.
Most projects placed in service in 2012 focused on removing constraints that blocked natural gas from the booming Marcellus shale gas from reaching markets in the Northeast. Northeastern pipe additions accounted for two-thirds of all new pipeline mileage placed service in 2012. These additions included large projects such as the Appalachian Gateway Project and the Sunrise Project, both of which are designed to transport natural gas from the Marcellus production zone to markets in the Northeast.
Despite this growth, the New England and New York markets still experience frequent pipeline constraints, meaning that inbound pipeline capacity is insufficient to transport enough gas to meet consumer demand many days per year. This results in not only volatile natural gas pricing in New England, but fundamentally higher prices for consumers. Because the price of natural gas in New England sets the price of electricity most of the time, the result is a double-whammy of high wholesale prices for both electricity and natural gas.
Further pipeline capacity expansions into New England could alleviate these bottlenecks, but it is unclear who will build the capacity or when it will occur. Until it does, New England will remain exposed to high and volatile prices for natural gas and electricity.
 | ||
| Graphic courtesy of the U.S. Energy Information Administration, available at http://www.eia.gov/todayinenergy/detail.cfm?id=10511. |
For the past several years, natural gas pipeline capacity in the U.S. has grown. According to EIA, overall investment in domestic natural gas pipeline capacity slowed in 2012, but the northeast United States was home to the majority of growth. Other than facilities for gathering, storing, and distributing natural gas, natural gas pipeline capacity expansions totaled $1.8 billion in capital expenditures in 2012, adding 4.5 billion cubic feet per day of new pipeline capacity and 367 miles of pipe.
Most projects placed in service in 2012 focused on removing constraints that blocked natural gas from the booming Marcellus shale gas from reaching markets in the Northeast. Northeastern pipe additions accounted for two-thirds of all new pipeline mileage placed service in 2012. These additions included large projects such as the Appalachian Gateway Project and the Sunrise Project, both of which are designed to transport natural gas from the Marcellus production zone to markets in the Northeast.
Despite this growth, the New England and New York markets still experience frequent pipeline constraints, meaning that inbound pipeline capacity is insufficient to transport enough gas to meet consumer demand many days per year. This results in not only volatile natural gas pricing in New England, but fundamentally higher prices for consumers. Because the price of natural gas in New England sets the price of electricity most of the time, the result is a double-whammy of high wholesale prices for both electricity and natural gas.
Further pipeline capacity expansions into New England could alleviate these bottlenecks, but it is unclear who will build the capacity or when it will occur. Until it does, New England will remain exposed to high and volatile prices for natural gas and electricity.
Utilities switching from coal to gas
Friday, September 7, 2012
Utilities around the country are closing or converting older coal-fired power plants, and increasing the use of natural gas. Pressure to make this shift comes from several factors, including tighter regulation of air emissions and the low price of natural gas compared to recent history.
One electric generation plant that may illustrate this trend is Dominion Virginia Power's Bremo Power Station on the James River in central Virginia. Originally built by the Virginia Electric & Power Company in 1931, the plant can now produce 227 megawatts of electricity by burning coal to boil water; the resulting steam spins turbines attached to electric generators. According to Dominion, the Bremo plant consumes an average of 2,500 tons of coal per day.
This week Dominion announced plans to convert the Bremo plant from coal to natural gas. In a filing with the Virginia State Corporation Commission, the regulatory body responsible for electric utilities, Dominion asked for approval to convert the plant over the next year at an estimated cost of $53.4 million. If the SCC approves the conversion, the utility anticipates stopping coal consumption at the plant by the fall of 2013.
Dominion had previously agreed to convert the Bremo Power Station by spring 2014 as part of the air permit it received for the 585-megawatt Virginia City Hybrid Energy Center. That plant entered commercial operations in July of this year, burning a mix of coal and biomass.
Dominion describes the Bremo conversion as being the ninth company-owned, coal-fired power station with units recently announced to be closed or converted to alternative fuels. The utility points to the uneconomic nature of operating smaller, older coal-fired stations given the spread of cheaper natural gas and new environmental regulations requiring operators to retrofit plants with upgraded emission control equipment. According to Dominion, the Bremo conversion would allow consumers to save about $155 million when compared to continued operation on coal.
Other utilities are making similar conversions or are considering closing some existing coal-fired plants. Natural gas consumption is on the rise, particularly in the electric generation sector. At the same time, many utilities continue to rely on coal as part of their generation portfolio, as evidenced by Dominion's construction of the the primarily coal-fired Virginia City plant. The trend appears to be one of closing or converting older or smaller coal-fired plants, consolidating coal consumption in larger, newer plants and increasing the use of natural gas to produce power.
 |
| The stacks of the Salem Harbor Power Station rise above Cat Cove in Salem, Massachusetts. Dominion announced last year that it would close this plant, which it then sold to Footprint Power. |
One electric generation plant that may illustrate this trend is Dominion Virginia Power's Bremo Power Station on the James River in central Virginia. Originally built by the Virginia Electric & Power Company in 1931, the plant can now produce 227 megawatts of electricity by burning coal to boil water; the resulting steam spins turbines attached to electric generators. According to Dominion, the Bremo plant consumes an average of 2,500 tons of coal per day.
This week Dominion announced plans to convert the Bremo plant from coal to natural gas. In a filing with the Virginia State Corporation Commission, the regulatory body responsible for electric utilities, Dominion asked for approval to convert the plant over the next year at an estimated cost of $53.4 million. If the SCC approves the conversion, the utility anticipates stopping coal consumption at the plant by the fall of 2013.
Dominion had previously agreed to convert the Bremo Power Station by spring 2014 as part of the air permit it received for the 585-megawatt Virginia City Hybrid Energy Center. That plant entered commercial operations in July of this year, burning a mix of coal and biomass.
Dominion describes the Bremo conversion as being the ninth company-owned, coal-fired power station with units recently announced to be closed or converted to alternative fuels. The utility points to the uneconomic nature of operating smaller, older coal-fired stations given the spread of cheaper natural gas and new environmental regulations requiring operators to retrofit plants with upgraded emission control equipment. According to Dominion, the Bremo conversion would allow consumers to save about $155 million when compared to continued operation on coal.
Other utilities are making similar conversions or are considering closing some existing coal-fired plants. Natural gas consumption is on the rise, particularly in the electric generation sector. At the same time, many utilities continue to rely on coal as part of their generation portfolio, as evidenced by Dominion's construction of the the primarily coal-fired Virginia City plant. The trend appears to be one of closing or converting older or smaller coal-fired plants, consolidating coal consumption in larger, newer plants and increasing the use of natural gas to produce power.
Corn, ethanol, drought, and demand
Thursday, July 12, 2012
Corn plays an important role in current United States transportation fuel policy - but environmental and economic factors are putting the pinch on corn ethanol producers.
The U.S. Renewable Fuel Standard program requires transportation fuel sold in the United States to contain at least a minimum volume of renewable fuel. This renewable fuel is generally ethanol, produced by fermenting sugars contained in plant feedstocks like sugar cane and sugar beets, or sugars produced by converting plant-based starches like corn starch. The program's goals include reducing greenhouse gas emissions from the transportation sector, reducing petroleum imports, and encouraging the development and expansion of the domestic renewable fuels sector.
In the U.S., more than 95 percent of operating ethanol plants reportedly use corn starch as their feedstock. According to the U.S. Department of Agriculture, U.S. farmers planted 96.4 million acres of corn this year, the highest corn acreage since 1937. Favorable field conditions this spring led to the quickest planting pace on record, with nearly all of the corn planted by May 20 and plants emerged by June 3.
This summer's high temperatures and widespread drought conditions - with nearly 56% of the area of the 48 contiguous states experiencing drought - have hurt the U.S. corn crop, resulting in reduced estimates for this year's crop. This anticipated reduction is driving corn prices up, with the commodity trading at over $7 per bushel (contrast a 2007 U.S. Energy Information Administration analysis of transportation biofuels assuming corn prices of about $2 per bushel). This price increase is cutting into ethanol producers' bottom line.
At the same time, transportation fuel consumers are driving less. Between increased fleet efficiency prompted by both governmental mandates and a natural desire to cut costs, and the overall slowdown in the national economy, overall demand for ethanol fuel has not grown at the pace previously projected.
According to Reuters, the average ethanol plant operating in Illinois is currently losing 32 cents on every gallon it produces. As a result, many ethanol plants are running below their production capacity, and several have announced planned closures. EIA data shows that ethanol production dropped 4% last week to 821,000 barrels per day, the lowest production rate since July 23, 2010.
Proponents of blending ethanol into transportation fuels point to its nature as a renewable biofuel, lower cost than gasoline, and ability to be produced domestically. Critics question the wisdom of converting a potential food crop into an energy commodity, as well as the economic and environmental consequences of current pro-ethanol policies. Whatever the ultimate outcome, the climatic and economic conditions affecting the corn ethanol industry may be calling into question the sustainability of the current system.
Electricity and natural gas market links
Wednesday, July 11, 2012
Concerns over the increasing interdependence of natural gas and electricity markets in the United States have prompted federal regulators to schedule a series of technical conferences on the subject for next month.
In recent years, natural gas has increased its share of the energy mix used to generate electricity. Usage of coal, historically the dominant fuel used to generate electricity, is declining, while natural gas pricing is historically low. This shift to increased reliance on natural gas is also driven in part by the growth of intermittent renewable energy resources like wind which may need natural gas to back them up when the wind isn't blowing.
At the same time, investigations into the blackouts and reliability problems like those affecting Texas and the Southwest in February of 2011 suggest that a lack of coordination between the electricity and gas industries may be partly responsible for the outages.
On February 3, 2012, Federal Energy Regulatory Commission Commissioner Philip Moeller issued a letter posing a series of questions concerning gas-electric interdependence. His questions included what role the FERC should play in overseeing better coordination between the two industries, what regional differences might affect this coordination, and differences in how electricity and gas are traded in their respective markets.
In response to Commissioner Moeller's letter, a variety of stakeholders submitted comments. Many commenters suggested that significant regional differences exist in both how markets operate and how their coordination could be improved.
As a result, the FERC has scheduled a series of regionally-oriented technical conferences for August:
- Central (generally the areas controlled by Midwest Independent Transmission System Operator Inc. (MISO), Southwest Power Pool, Inc. (SPP) and Electric Reliability Council of Texas (ERCOT)), to be held August 6, 2012, in St. Louis, MO
- Northeast (generally the area controlled by ISO New England, Inc.), to be held August 20, 2012, in Boston, MA
- Southeast (generally the areas controlled by Southern Company, Duke and Progress Energy, TVA, as well as other areas south of PJM Interconnection, L.L.C. (PJM) and East of SPP and ERCOT), to be held August 23, 2012, at FERC headquarters in Washington, DC
- West (generally the Western Interconnection), to be held August 28, 2012, in Portland, OR
- Mid-Atlantic (generally the areas controlled by New York Independent System Operator Inc. (NYISO), PJM and related areas), to be held August 30, 2012, at FERC headquarters in Washington, DC
Report on 2011 New England electricity market
Friday, June 29, 2012
New England electricity markets operated competitively and relatively efficiently in 2011, according to a report filed with federal regulators earlier this week. The 2011 Assessment of the ISO New England Electricity Markets (184-page PDF), prepared by New England's external market monitor, reports on how the market performed last year, with a focus on evaluating efficiency and competitiveness.
ISO New England Inc. is the regional transmission organization covering most of New England. In this role, ISO New England performs three major functions: overseeing operation of New England's bulk power generation and transmission system, administering the region's wholesale electricity markets, and managing regional planning processes. ISO New England is regulated by the Federal Energy Regulatory Commission, and has both internal and external market monitors who review its performance. The internal market monitor is a unit within ISO New England Inc., while the external market monitor is an independent outside consultant. Potomac Economics currently serves as the external market monitor.
Potomac's report found that "the markets performed competitively in 2011". One piece of evidence Potomac used to support this finding is that average energy prices fell 7 percent from 2010 to 2011 (from approximately $53 per MWh in 2010 to $49 in 2011). According to the report, this is due in large part to a decrease in the average price of natural gas. In Potomac's view, lower fuel costs translate to lower prices in a well-functioning, competitive market because fuel costs constitute the vast majority of the marginal costs of most generation. Natural gas pricing decreases were not the only contributor to lower energy prices, according to the report; Potomac also noted that prices fell due to a weather-driven decrease in demand for electricity, stating that, "Average load decreased 1 percent from 2010 to 2011 and 2.5 percent from the summer of 2010 to the summer of 2011, primarily due to milder weather."
Potomac also found that "both the day-ahead and real-time markets operated relatively efficiently in 2011 as prices appropriately reflected the effects of lower fuel prices and load levels." However, the external market monitor found that "real-time prices often do not fully reflect the cost of satisfying demand and maintaining reliability during tight market conditions, particularly when fast-start resources or demand response resources are deployed in the real-time market." As a result, the report recommended a series of changes to the New England markets, including developing pricing changes to allow the actual costs of demand response and fast-start resources to be reflected in prices.
The report was filed with the Federal Energy Regulatory Commission on June 25. It complements the 2011 Annual Markets Report (121-page PDF), released this May by ISO New England's internal market monitor. The internal market monitor's report similarly found that the markets operated competitively in 2011.
Proposed Long Canyon energy project
Tuesday, March 27, 2012
Last week the Federal Energy Regulatory Commission accepted for filing an application for a preliminary permit for a pumped storage project in the Utah desert. In January, Utah Independent Power, Inc. filed for a preliminary permit. The Long Canyon Pumped Storage Project would entail two dams to store water drawn
from the Colorado River near Moab, Utah. (Here's a topographic map of the general location.)
Pumped storage projects are one way to store energy. Electricity that is generated can be converted into potential energy stored in water by pumping it uphill. That energy, or most of it, can be captured and converted back into electricity on command.
Utah Independent Power's application to FERC for a preliminary permit for the Long Canyon Pumped Storage Project (18-page PDF) provides some details on how the project might work. Initially, water from the river would be pumped into the lower reservoir. When electricity is abundant and low-priced, the project would consume electricity to pump water from the lower reservoir uphill to the upper reservoir. When electricity is scarce or commands a high enough price, the project would release water downhill through turbines to produce up to 800 megawatts of hydroelectric energy. In a typical pumped storage project, the same pumps used to send water uphill can be used as turbines when the water flows back down. The owned of a pumped storage project seeks to earn profits by taking advantage of the difference between off-peak energy prices and the prices available during peak demand.
Now that the Commission has accepted the application for filing, the application is open for 60 days for public comment or a showing of interest in the site by a competing developer. After that period, and after a technical and legal review of the application by Commission staff, the Commission may issue a preliminary permit to the applicant. A preliminary permit does not authorize the permittee to actually construct anything; rather, it confers first priority of application for a license - what the Commission calls "guaranteed first-to-file status" - while the permittee studies the site and prepares to apply for a license, typically for a term of 3 years.
 |
| A water pipe buried in the desert soil in Arches National Park, near Moab, Utah. |
Pumped storage projects are one way to store energy. Electricity that is generated can be converted into potential energy stored in water by pumping it uphill. That energy, or most of it, can be captured and converted back into electricity on command.
Utah Independent Power's application to FERC for a preliminary permit for the Long Canyon Pumped Storage Project (18-page PDF) provides some details on how the project might work. Initially, water from the river would be pumped into the lower reservoir. When electricity is abundant and low-priced, the project would consume electricity to pump water from the lower reservoir uphill to the upper reservoir. When electricity is scarce or commands a high enough price, the project would release water downhill through turbines to produce up to 800 megawatts of hydroelectric energy. In a typical pumped storage project, the same pumps used to send water uphill can be used as turbines when the water flows back down. The owned of a pumped storage project seeks to earn profits by taking advantage of the difference between off-peak energy prices and the prices available during peak demand.
Now that the Commission has accepted the application for filing, the application is open for 60 days for public comment or a showing of interest in the site by a competing developer. After that period, and after a technical and legal review of the application by Commission staff, the Commission may issue a preliminary permit to the applicant. A preliminary permit does not authorize the permittee to actually construct anything; rather, it confers first priority of application for a license - what the Commission calls "guaranteed first-to-file status" - while the permittee studies the site and prepares to apply for a license, typically for a term of 3 years.
Some Maine electricity prices fall
Tuesday, March 20, 2012
According to the Maine Public Utilities Commission, the price of electricity is falling for some customers. The Maine PUC recently set prices for standard offer electricity service for large commercial and industrial customers for next month. These prices - 3.2 cents/kWh for Central Maine Power customers and 3.1 cents/kWh for Bangor Hydro-Electric customers - are 10% lower than prices in March and 25% to 35% lower than prices one year ago. Observers point to even lower wholesale power prices, driven largely by the availability of inexpensive natural gas.
In the late 1990s, Maine restructured its electricity market into two components: supply and delivery. Previously, Maine utilities operated both facilities for generating electricity (generation) and for delivering it to consumers (transmission and distribution). Today, thanks to the deregulation of generation and restructuring of the market, these functions are separate. In today's Maine marketplace, energy supply refers to buying the electricity itself from a competitive wholesale market, while delivery is the service provided by transmission and distribution utilities in delivering the energy to consumers.
Maine consumers are free to select a competitive electricity provider for their energy supply. As an alternative, customers can choose not to choose, instead automatically participating in a utility-wide pool of "default service" or "standard offer" electricity purchases.
Maine recently revised the structure of standard offer service for large commercial and industrial customers. Standard offer customers in these classes now pay a 2-part price for their energy supply: an energy charge indexed to wholesale power market prices, plus a capacity charge based on each customer’s peak usage. On top of these standard offer charges, customers also pay their local utility to deliver the power.
Many larger consumers have found that they are able to procure electricity at a lower cost than the standard offer, either through a competitive supplier or by participating in the wholesale market directly. For others, the standard offer provides some certainty and medium-term price stability for energy purchases, although standard offer prices change monthly and can be more volatile than some competitive alternatives.
National park energy use and strategies
Friday, December 9, 2011
Small-scale alternative energy resources play an increasing role in how the U.S. National Park Service manages its lands, budget, and energy usage.
The United States National Park Service manages about 84.4 million acres of land in the form of national parks, national monuments, and other historic and conservation properties. While much of the Park Service's holdings are preserved as undeveloped backcountry properties, the NPS provides visitor amenities like lodging, food and other concession services.
The remote locations of many Park Service sites make traditional energy resources expensive and challenging. Ranger stations and campground bathrooms may be located far from the traditional utility electric grid. Diesel generators can be used if road access to the site is possible, but have drawbacks: fuel is expensive, and generators can be loud, produce emissions, and may be out of character for a particular national park site.
In some cases, the Park Service is turning away from traditional energy resources to alternative and distributed energy resources like solar power. In fact, the Park Service has deployed distributed solar photovoltaic generation for over a decade.
Consider the example of Devil's Garden Campground in Arches National Park in Utah. While the campground is relatively remote (located at the end of a 30-mile dead-end road inside the park), Park Service facilities in the campground need electricity. These facilities include two campground hosts, three bathrooms, an amphitheater and a ranger station.
Historically, electricity for the campground facilities came from on-site diesel generators. These units ran 24 hours a day, consuming over 6,400 gallons of fuel per year. Producing electricity from diesel is seldom cost-competitive today; generating electricity from diesel at Devil's Garden Campground cost the National Park Service over $22,400 per year. This meant that the Park Service was generating electricity for a price of 28 cents per kilowatt-hour (kWh), about four times higher than the current average Utah price.
(As expensive as this is, it's still about a third of the cost of diesel-generated electricity on the remote Maine island of Monhegan. In 2010, electricity on Monhegan cost an average of 74.51 cents per kWh.)
As early as 1995, the Park Service joined with the state of Utah to develop four photovoltaic/diesel hybrid systems at Devil's Garden Campground. Each system is composed of a 1.4 kilowatt (kW) tracking array, a 4 kW inverter and a 40 kWh battery bank. Diesel units remain on-site and ready, but now run less than 4 hours per day. This cut the Park Service's annual operation and maintenance costs for the diesel generators from $22,400 to $10,000. The project dramatically reduced the noise level in the campground, and significantly cut the diesels' emissions of carbon dioxide, carbon monoxide, nitrogen oxides, and sulfur oxides.
As this example shows, sites that are already off the grid can be good candidates for small-scale distributed generation projects relying on alternative technologies like solar. Depending on project economics and other objectives (like the Park Service's sustainability initiative, improving noise levels and air quality, or education), replacing diesel with renewable energy -- and making energy efficiency improvements -- can make sense.
Other units in the National Park Service system are following the Arches example by turning to distributed renewable energy and energy efficiency. In 2011, Yosemite National Park installed a 672 kilowatt grid-tied solar array. The $5.8 million Yosemite project is bigger in scale (the Park Service's largest solar energy project) and is tied to the utility electric grid, but represents a similar strategy to that used in Arches and throughout the Park Service.
 |
| Solar panels line the roof of the comfort station at Devil's Garden Campground in Arches National Park, Utah. |
The United States National Park Service manages about 84.4 million acres of land in the form of national parks, national monuments, and other historic and conservation properties. While much of the Park Service's holdings are preserved as undeveloped backcountry properties, the NPS provides visitor amenities like lodging, food and other concession services.
The remote locations of many Park Service sites make traditional energy resources expensive and challenging. Ranger stations and campground bathrooms may be located far from the traditional utility electric grid. Diesel generators can be used if road access to the site is possible, but have drawbacks: fuel is expensive, and generators can be loud, produce emissions, and may be out of character for a particular national park site.
In some cases, the Park Service is turning away from traditional energy resources to alternative and distributed energy resources like solar power. In fact, the Park Service has deployed distributed solar photovoltaic generation for over a decade.
Consider the example of Devil's Garden Campground in Arches National Park in Utah. While the campground is relatively remote (located at the end of a 30-mile dead-end road inside the park), Park Service facilities in the campground need electricity. These facilities include two campground hosts, three bathrooms, an amphitheater and a ranger station.
Historically, electricity for the campground facilities came from on-site diesel generators. These units ran 24 hours a day, consuming over 6,400 gallons of fuel per year. Producing electricity from diesel is seldom cost-competitive today; generating electricity from diesel at Devil's Garden Campground cost the National Park Service over $22,400 per year. This meant that the Park Service was generating electricity for a price of 28 cents per kilowatt-hour (kWh), about four times higher than the current average Utah price.
(As expensive as this is, it's still about a third of the cost of diesel-generated electricity on the remote Maine island of Monhegan. In 2010, electricity on Monhegan cost an average of 74.51 cents per kWh.)
As early as 1995, the Park Service joined with the state of Utah to develop four photovoltaic/diesel hybrid systems at Devil's Garden Campground. Each system is composed of a 1.4 kilowatt (kW) tracking array, a 4 kW inverter and a 40 kWh battery bank. Diesel units remain on-site and ready, but now run less than 4 hours per day. This cut the Park Service's annual operation and maintenance costs for the diesel generators from $22,400 to $10,000. The project dramatically reduced the noise level in the campground, and significantly cut the diesels' emissions of carbon dioxide, carbon monoxide, nitrogen oxides, and sulfur oxides.
As this example shows, sites that are already off the grid can be good candidates for small-scale distributed generation projects relying on alternative technologies like solar. Depending on project economics and other objectives (like the Park Service's sustainability initiative, improving noise levels and air quality, or education), replacing diesel with renewable energy -- and making energy efficiency improvements -- can make sense.
Other units in the National Park Service system are following the Arches example by turning to distributed renewable energy and energy efficiency. In 2011, Yosemite National Park installed a 672 kilowatt grid-tied solar array. The $5.8 million Yosemite project is bigger in scale (the Park Service's largest solar energy project) and is tied to the utility electric grid, but represents a similar strategy to that used in Arches and throughout the Park Service.
February 2, 2011 - weather leads ERCOT to rolling blackouts
Wednesday, February 2, 2011
What happens when bad weather strikes the power grid? Depending on the storm, and the region, some customers may lose power if distribution lines are damaged. More serious cases, like when key generators are tripped offline, may lead to more serious consequences.
Groundhog Day 2011 in Texas provides an example of the more serious consequences: power prices rising to 40 times their previous level, coupled with rolling blackouts. The Electric Reliability Council of Texas, or ERCOT, operates the electric grid and manages the deregulated market for 75 percent of the state: about 22 million customers in areas including Houston, Dallas, Fort Worth, San Antonio, Austin, Corpus Christi, Abilene and the Rio Grande Valley.
Thanks to the weather, apparently there just isn't enough power to go around. Reports indicate that ERCOT has imposed rolling blackouts after multiple power plants were disabled by a major ice storm. Rolling blackouts are an extraordinary measure, seen more often in other countries than in the U.S. When the utility cuts your power, unless you're connected to distributed generation or storage, your lights will go dark.
Beyond the rolling blackouts, the price of energy may lead to other consumer impacts. Reuters reports that hourly energy prices in ERCOT rose from $50 per megawatt-hour to $2,000 per megawatt-hour, a forty-fold increase. (Although individual residential ratepayers may not feel that price spike directly, it would translate into paying $2.00 per kilowatt-hour if they did - and large commercial and industrial ratepayers who buy power at wholesale in the market are exposed to these prices directly.) Sounds like a good time for demand response!
January 28, 2011 - Utah power prices
Friday, January 28, 2011
Earlier this month, I noted that low power prices in Utah are attracting development and jobs to that state. For example, the National Security Agency chose Utah to site a new 1 million square foot data center that may consume up to 65 megawatts of power - electricity that is generally cheaper in Utah than in many other states. (The EIA reports that the September 2010 average all-sector electricity price in Utah was just 7.42 cents per kWh, significantly below the U.S. average of 10.24 cents per kWh for that time period.)
Now, PacifiCorp, operating as Rocky Mountain Power in Utah, has requested permission from the Public Service Commission of Utah to increase prices by an overall average of 13.7 percent. Rocky Mountain Power describes this price request as "necessary to serve our Utah customers’ growing electricity needs and to comply with environmental requirements". In a 4-page PDF, Rocky Mountain Power points to increasing demand in Utah, and forecasts continued increases in demand based on forecasts of economic growth. (As I noted last year, energy consumption has traditionally been viewed as directly correlated to GDP.) Rocky Mountain Power states that building new facilities (generation and transmission) is more expensive than older facilities: "Our newest power plants are primarily natural gas and wind projects. While among the lowest cost options today, either one is about twice as expensive as the generating plants built in the 1970s and early 1980s." Finally, Rocky Mountain Power points out, "Compared with our largest industrial customers, the company’s returns are modest and in line with other electricity providers."
The Public Service Commission of Utah will now consider Rocky Mountain Power's request.
January 7, 2011 - data center power demands
Friday, January 7, 2011
As the volume of digital data we create and consume increases, how much electricity is required to store, manage and analyze this information? Smart grid technology has been described as relying on the "internet of things", a vision becoming real of constant real-time data communications between interconnected devices like home appliances, heating systems, and vehicles and the overall power grid. This will represent a multifold increase in the volume of data being produced - and for those entities interested in analyzing that data, a likely increase in the volume of energy required to do so.
Even now, when smart grid communications are still a relatively small portion of the total volume of data flying around the country, it can take a surprisingly large amount of electricity to run a data storage and analysis center. In Utah, the National Security Agency has just broken ground for its Utah Data Center, a complex enclosing about 1 million square feet of space, 100,000 square feet of which will be devoted to computer hardware. Sen. Orrin Hatch has been quoted as describing the data center as creating 100 to 200 jobs for information technology specialists and engineers. The NSA describes the data center as a component of the Comprehensive National Cyber-security Initiative designed to help the intelligence community meet domestic cyber-security requirements.
So how much power will the Utah Data Center consume? Apparently up to 65 megawatts. Indeed, the availability and cost of that much power was one factor behind the siting of the facility in Utah. In 2006, the agency reportedly nearly consumed the entire free electric capacity of the Baltimore, Maryland power grid, causing the agency to look elsewhere for the installation of this new computing capacity. The relatively low cost of energy in Utah may also have been attractive; the EIA reports that the September 2010 average all-sector electricity price in Utah was just 7.42 cents per kWh, significantly below the U.S. average of 10.24 cents per kWh for that time period, let alone costlier markets like Washington, D.C. (13.74 cents/kWh), California (15.27 cents/kWh), or Connecticut (17.26 cents/kWh).
As society generates more and more data, can we expect to see more and more data centers? Will they consume more and more electricity? Because data can be directed to any geographic location, does this place areas with less expensive power at a relative advantage for the economic development opportunities posed by data centers?
November 23, 2010 - Cape Wind contract approved at 18.7 cents/kWh
Tuesday, November 23, 2010
Throughout 2010, I've been watching the Cape Wind project work its way through the development and regulatory processes. The project has generated controversy over a variety of issues, including siting (should the project be built in Nantucket Sound? if so, where?) and cost (should ratepayers be on the hook for a long-term power purchase agreement for the project's output? if so, at what price?). This latter issue falls under the jurisdiction of the Massachusetts Department of Public Utilities.
This week the DPU issued a decision approving a 15-year power purchase agreement between Cape Wind and National Grid. (The order itself is 374 pages.) Under the deal, National Grid will buy half of Cape Wind’s output for 18.7 cents per kilowatt-hour, with a 3.5% annual escalator in each of the 15 contract years. Some consumer advocates note that this is significantly higher than the most recent average annual wholesale power price in the region: 5.5 cents per kilowatt-hour. Proponents of the project point out that the 18.7 cent price includes the energy itself, capacity value, and renewable energy credits. A closer analysis of this suggests some flaws: the value of capacity plus renewable energy credits generally may not be worth the $132 per MWh price increase. Arguably the difference and that offshore wind has a social or intrinsic value that makes the price worth it.
The DPU acknowledged that the pricing is high:
If 18.7 cents seems high, it is among the lowest of the many of the recent proposed prices for offshore wind. It's worth noting that 18.7 cents per kWh is lower than the price set in previous proposed iterations of this contract. In May 2010, National Grid agreed to a deal at 20.7 cents per kWh (subject to DPU approval, which was withheld). The May proposal in turn was lower than the initial Deepwater Wind proposal off Rhode Island's Block Island, which proposed 24.4 cent per kWh power escalating 3.5% annually for 20 years to a final price of 48.6 cents per kWh. (And even that price was lower than the one Deepwater initially offered National Grid: 30.7 cents per kWh.)
The next step for Cape Wind is to look for a purchaser for the other half of its power. What kind of power purchase agreement will they find? If the DPU's approval of this contract establishes a pricing trend, we may see similar pricing in the second PPA.
This week the DPU issued a decision approving a 15-year power purchase agreement between Cape Wind and National Grid. (The order itself is 374 pages.) Under the deal, National Grid will buy half of Cape Wind’s output for 18.7 cents per kilowatt-hour, with a 3.5% annual escalator in each of the 15 contract years. Some consumer advocates note that this is significantly higher than the most recent average annual wholesale power price in the region: 5.5 cents per kilowatt-hour. Proponents of the project point out that the 18.7 cent price includes the energy itself, capacity value, and renewable energy credits. A closer analysis of this suggests some flaws: the value of capacity plus renewable energy credits generally may not be worth the $132 per MWh price increase. Arguably the difference and that offshore wind has a social or intrinsic value that makes the price worth it.
The DPU acknowledged that the pricing is high:
The power from this contract is expensive in light of today‖s energy prices. It may also be expensive in light of forecasted energy prices—although less so than its critics suggest. There are opportunities to purchase renewable energy less expensively. However, it is abundantly clear that the Cape Wind facility offers significant benefits that are not currently available from any other renewable resource. We find that these benefits outweigh the costs of the project.
One of the many benefits that Cape Wind provides is that it will assist National Grid and Massachusetts in meeting the renewable energy requirements of the Green Communities Act, as well as the greenhouse gas emissions reduction requirements of the Global Warming Solutions Act. Meeting those greenhouse gas emission mandates will require significant investments across all sectors of the economy, and especially from the electricity sector. We conclude that those requirements are unlikely to be met without the Cape Wind contract and the associated emissions reductions from the project.
If 18.7 cents seems high, it is among the lowest of the many of the recent proposed prices for offshore wind. It's worth noting that 18.7 cents per kWh is lower than the price set in previous proposed iterations of this contract. In May 2010, National Grid agreed to a deal at 20.7 cents per kWh (subject to DPU approval, which was withheld). The May proposal in turn was lower than the initial Deepwater Wind proposal off Rhode Island's Block Island, which proposed 24.4 cent per kWh power escalating 3.5% annually for 20 years to a final price of 48.6 cents per kWh. (And even that price was lower than the one Deepwater initially offered National Grid: 30.7 cents per kWh.)
The next step for Cape Wind is to look for a purchaser for the other half of its power. What kind of power purchase agreement will they find? If the DPU's approval of this contract establishes a pricing trend, we may see similar pricing in the second PPA.
Subscribe to:
Comments (Atom)