Showing posts with label energy intensity. Show all posts

EIA says 2016 U.S. energy expenditures declined to lowest share of GDP since 1970

Thursday, January 24, 2019

According to the most recent data released by the U.S. Energy Information Administration, in 2016, U.S. energy expenditures declined for the fifth consecutive year, reaching $1.0 trillion in 2016. This represents a 9% decrease in real terms from 2015.

Adjusted for inflation, total energy expenditures in 2016 were the lowest since 2003. Expressed as a percent of gross domestic product (GDP), total energy expenditures were 5.6% in 2016, the lowest share of GDP since at least 1970. According to EIA, contributing factors include steady annual increases in GDP since 2010, coupled with steady annual decreases in total energy expenditures since 2011.

Source: EIA, "In 2016, U.S. energy expenditures per unit GDP were the lowest since at least 1970"

Meanwhile, annual total U.S. energy consumption has remained virtually flat since 2013. So the recent decreases in total energy expenditures are generally the result of lower energy prices. But EIA says it doesn’t expect this trend to continue, as average energy prices of products such as motor gasoline, natural gas, and retail electricity have all increased since 2016.

Source: EIA, "In 2016, U.S. energy expenditures per unit GDP were the lowest since at least 1970"
EIA also notes significant geographic variation in state total energy expenditures as a percent of state GDP. In 2016, Louisiana led the pack as it has every year since EIA started tracking this metric in 1997, with 2016 energy expenditures per GDP of 11.1% in 2016. EIA points to Louisiana’s large industrial sector consumption, including its energy-intensive petrochemical industry, as the biggest piece of the explanation.

Source: EIA, "In 2016, U.S. energy expenditures per unit GDP were the lowest since at least 1970"

But even while leading the nation, Louisiana set its own record-low ratio of energy expenditures per GDP, at a level that was less than half of the state’s previous high (26.5%) which was reached in 2008. Meanwhile, District of Columbia (1.6%), New York (3.3%), Massachusetts (4.3%), California (4.3%), and Delaware (4.4%) had the lowest energy expenditures per GDP in 2016. EIA says this reflects relatively high consumption in less energy-intensive residential and commercial sectors as well as relatively high state GDP.

Oil sands: an "unconventional" oil resource

Monday, January 28, 2013

New technologies enable the production of petroleum from unconventional oil resources such as "tar sands" and oil shale.  While traditional oil wells have been drilled for over 2,000 years, unconventional resources offer the opportunity to develop new petroleum sources - and by extension, to shift the balance of power and economics away from traditional sources.  At the same time, producing oil from oil sands may have environmental impacts that are different from traditional wells.  What are tar sands or oil sands?

Oil sands, also known as bituminous sands, are loose sand or partially consolidated sandstone saturated with a dense and viscous form of petroleum technically referred to as bitumen.  Oil sands are often called "tar sands" due to bitumen's sticky, dark nature.  ("Tar" technically refers to a product made by distilling pitch from the wood and roots of pine trees, and was historically used to describe the sticky black residue left behind when distilling coal gas.) 

Bitumen is so viscous that it cannot be pumped directly from the ground through traditional wells.  Oil sand deposits are typically mined using open pits or strip mining.  The mined material is mixed with water at an extraction plant, where the bitumen can be separated from the remaining minerals, sand, and water.  The bitumen can then be transported for upgrading or conversion into synthetic crude oil.

Alternatively, bitumen can be extracted by heating the raw sands in place.  In-situ production methods include injecting steam or solvents, or piping in oxygen and igniting some of the bitumen.  These methods rely on the use of large amounts of water and energy.

According to the U.S. government's 2012 oil shale and tar sands programmatic environmental impact statement, about two tons of tar sands can produce one barrel of oil.  Extraction and processing typically require several barrels of water for each barrel of oil produced.  Some of this water can be recycled.
About three-quarters of the bitumen can be extracted from the raw material.  Spent sand and other materials are typically returned to the mine after processing.

Producing oil from bitumen derived from tar sands can have significant environmental impacts.  The mining and upgrading processes are energy-intensive and result in emissions of greenhouse gases and air pollutants.  Mine sites are typically significantly disturbed, and impacts to water may be both local and throughout the downriver watershed.  The association between the proposed Keystone XL pipeline and oil sand resources in Alberta, Canada led to environmental opposition to that pipeline.

Producing oil from oil sands may be controversial, but Canada possesses the world's largest known resources and is developing them rapidly.  Canada points to environmental regulations and controls, as well as economic development benefits.  Developing oil sand resources creates jobs and economic growth, and mine sites are typically in rural areas eager for opportunity.  If the U.S. does not approve the Keystone XL pipeline, Canadian producers may push for an alternative route to refineries or export terminals in British Columbia, obviating the need for U.S. approval.

Economically, synthetic crude oil produced from oil sands bitumen can be cost-effective if the price of oil produced from traditional wells is high.  On the other hand, if oil from wells or other unconventional resources like oil shales can be produced cheaply, oil sands may not be economically competitive.  The significant capital investment required to produce bitumen from oil sands means that producers must often make long-term investments that risk losing money in some years.  Producers may also face the risk of tighter environmental standards, the cost of compliance, and any penalties for noncompliance.

Hospital energy use in focus

Friday, August 24, 2012

Hospitals provide essential services to society - but many hospitals consume large amounts of energy in fulfilling their mission.  Newly released data shows that large hospitals tend to consume more energy per square foot than do other commercial buildings.

The data released by the U.S. Energy Information Administration last week comes from the 2007 Commercial Buildings Energy Consumption Survey (CBECS).  While 2007-vintage data may seem a bit stale in 2012, the 2007 survey results are the most recently-released from the CBECS program, providing an update to the 2003 survey.  The survey considered the consumption of electricity, natural gas, fuel oil, and district heat (steam or hot water from an outside source used for heating) by a variety of types of commercial buildings.

According to EIA, the roughly 3,040 large hospitals operating in 2007 - defined as those over 200,000 square feet - consumed 458 trillion British thermal units (Btu) of energy in that year.  Of this total energy budget, most came in the form of natural gas and electricity: 208 trillion Btu of natural gas, 194 trillion Btu of electricity, 6 trillion Btu of fuel oil, and 49 trillion Btu of district heat.

Altogether, large hospitals consumed about 5.5% of the commercial sector's total energy consumption in 2007.  On a Btu per square foot basis, the EIA data suggests that large hospitals' energy intensity exceeds that of other commercial building types, with large hospitals accounting for only 2% of commercial floorspace in 2003.

This energy intensity may not be surprising: hospitals are typically open around the clock, have high demands for heating, ventilation, and air conditioning, and are home to a variety of energy-intensive activities ranging from laundry and food service to sterilization and computer servers.  Hospitals' need for a high degree of electric service reliability have led 95% of large hospitals to use energy for generating their own electricity, mostly in the form of fuel oil-fired emergency back-up generation.

At the same time, most hospitals' consciousness about their energy footprint has led them to pursue energy efficiency.  The EIA data shows that most large hospitals have energy management and conservation plans, and use energy-saving products like compact fluorescent lights or sophisticated services to reduce their consumption of electricity.

Still, the EIA data suggests that large hospitals still have room for improvement.  What more can hospitals do to reduce their energy footprint and its associated costs, while continuing to provide the services society demands?

June 8 - BP reports China passes US in energy consumption

Wednesday, June 8, 2011

As China's economy grows, it appears to have passed the U.S. in terms of total energy consumption.

Back in July 2010, I noted that the International Energy Agency claimed that China had passed the U.S. in terms of total energy consumed.  That IEA report showed that China used 2.252 billion tons of oil equivalent, whereas the U.S. used only 2.170 billion tons of oil equivalent.

Now, another observer (and key energy player) has confirmed China's leap to being the top energy consumer.  BP’s 60th annual Statistical Review of World Energy corroborates the IEA's findings, placing China in the top consumer slot as of 2010.  According to BP, China consumed 20.3% of total global energy demand last year.  This beats the U.S., which BP reports consumed 19% of the total global energy demand for 2010.

This reverses the trend for more than the past 100 years, when the United States has been considered to consume more energy than any other country. While energy consumption has traditionally been viewed as directly correlated to GDP, this shift breaks that trend as well. Commentators point to China's increased industrial activity, particularly significant in light of the current state of the American economy.

Interestingly, American energy intensity remains high: the average U.S. citizen uses five times as much energy as does the average Chinese citizen. What will happen when China reaches the energy intensity of the U.S.?

August 13, 2010 - Martha's Vineyard solar power; China

Friday, August 13, 2010

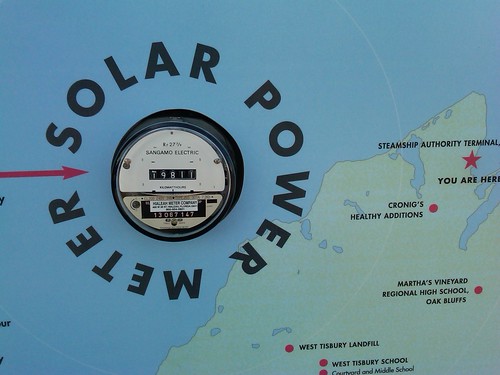
First, a solar power meter installed at the docks in Vineyard Haven on the island of Martha's Vineyard, Massachusetts. Martha's Vineyard is home to a variety of innovative energy solutions designed to stabilize and lower rates, strengthen reliability and security, and reduce air emissions.

Solar power meter, Vineyard Haven, MA

China's energy footprint continues to make news.  In July, a report by the International Energy Agency (IEA) said that in 2009, China was the world's largest energy consumer.  According to the IEA, in 2009, China consumed 2.25 billion tons of oil equivalent in 2009.  (Compare the U.S. at 2.17 billion tons -- close, but a lower number.)  China subsequently ordered over 2,000 industrial facilities to close over their energy consumption.  Now, China is refuting the IEA study's results.  Chinese statistical agencies now point to a 2009 energy consumption in China of 2.15 billion tons, arguably due to differences in how consumption is estimated.  Whatever China's total energy footprint is, China's large population means that China's energy intensity -- measured in energy consumed per capita -- is roughly 20% of that of the U.S.

The World Meteorological Organization is publicly linking flooding in places like China, Pakistan, and the U.S. with renewed predictions of disaster due to climate change.

Russia is reporting that Iran will soon load fuel into its nuclear reactor.

July 20, 2010 - China passes US as world's largest energy consumer; NextEra signs wind deal with Google

Tuesday, July 20, 2010

China has passed the United States as the world's largest consumer of energy. The International Energy Agency measures states' energy consumption in a unit called "oil equivalent". The most recent IEA report shows that China used 2.252 billion tons of oil equivalent, whereas the U.S. used only 2.170 billion tons of oil equivalent. This reverses the trend for more than the past 100 years, when the United States has been considered to consume more energy than any other country. While energy consumption has traditionally been viewed as directly correlated to GDP, this shift breaks that trend as well. Commentators point to China's increased industrial activity, particularly in light of the stagnant consumer-driven American economy.

Interestingly, American energy intensity remains high: the average U.S. citizen uses five times as much energy as does the average Chinese citizen. What will happen when China reaches the energy intensity of the U.S.?

NextEra's competitive energy subsidiary, NextEra Energy Resources, has entered into a power purchase agreement with Google Energy, LLC. Under the deal, Google will buy 114 megawatts of power from NextEra Energy Resources' Story II Wind Energy Center in Iowa.

June 16, 2010 - a look into historic energy usage

Wednesday, June 16, 2010

The United States Energy Information Administration tells us that in 2008, Americans consumed 99.304 quadrillion Btu of "primary energy" resources.

How much is that? One quadrillion Btu, or "quad", is one thousand million million Btu, or 10^15 Btu. One quad is roughly the amount of energy contained in:
* 8,007,000,000 Gallons (US) of gasoline
* 293,071,000,000 Kilowatt-hours (kWh)
* 36,000,000 tons of coal
* 970,434,000,000 Cubic feet of natural gas
* 5,996,000,000 gallons of diesel oil
* 25,200,000 tons of oil

Dividing the 99.304 quads by the U.S. population, each American is responsible for 327 million Btu annually. Energy intensity, or the annual per capita consumption, peaked for America in 1978-1979 at 359 million Btu, but we've been moving back and forth above 311 million Btu since 1968.

How do these numbers compare to historic figures? US EIA has an interesting table showing estimated primary energy consumption for the U.S. for 1635-1945. The table shows 0.001 quad consumption in 1645, the first year for which data is provided. By 1835, the figure has broken above one quad (1.305 quad). Energy consumption grows fairly linearly through 1900 (9.587 quad), after which the figure shoots up sharply.

In 1835, the official U.S. population was 14.7 million. This gives an 1835 intensity of 88 million Btu -- about one quarter of today's per capita consumption.

Interestingly, I suspect these figures don't take into account the literal horsepower provided by livestock in 1835. How much more energy do we really consume today?

March 10, 2010

Wednesday, March 10, 2010

Yarmouth, Maine, is considering an alternative energy source to power its wastewater treatment plant: hydrogen gas, created through technology proposed by Ronny Bar-Gadda, founder and chief executive officer of Genesys LLC. The Portland Press Herald provides a description:

He has developed a proprietary technology called radiant energy transfer. It uses electromagnetic radiation to break the hydrogen-oxygen bond at certain frequencies. The process was demonstrated last fall in the lab by filling a balloon with hydrogen made from wastewater. The radiant energy transfer unit, as Bar-Gadda calls it, can be scaled up in modules, uses minimal energy and produces hydrogen at a rapid rate.


From the physics and thermodynamics perspectives, I am very interested to see how this plays out.

Strong, Maine pellet producer Geneva Wood Fuels has been fined $27,000 by OSHA for violations ranging from missing handrails to potential problems with wood dust management -- and it's wood dust that may have been behind the explosion at the plant last year.

China has announced that it is back on track to meet its target of lowering energy intensity -- which is energy consumption per unit of GDP -- by 20% over 2006 levels by year's end. How? Government control. The Chinese government shuttered 60 gigawatts of older, inefficient thermal electricity units, and cracked down on manufacturers of iron, steel and cement.

It's CERAWeek in Houston, and apparently traditional fossil-fuel generators are laughing at the federal government's promotion of renewables. CERAWeek is the big conference sponsored by energy consultants IHS Cambridge Energy Research Associates.

US Department of Energy's Energy Information Administration says we'll pay more than $3 per gallon of gasoline in summer 2010. EIA also predicts oil prices rising from above $80 per barrel this spring to $82 per barrel by the end of 2009 and $85 per barrel by the end of 2011. EIA also predicts flat residential electricity prices: 11.5 cents per kilowatthour for this year, rising to 11.6 cents per kilowatthour in 2011.

Letter to the Editor of the Bangor Daily News from David Gordon of Oakfield talking about his town's approach to ensuring that wind development within the town provides benefits to ratepayers. Well written David.