Energy-related carbon dioxide emissions in the U.S. are projected to decrease by 2.2 percent in 2019 relative to the previous year, according to the latest forecast by the U.S. Energy Information Administration.
EIA tracks energy-related carbon dioxide emissions from petroleum, natural gas, and coal. Petroleum made up nearly half of energy-related CO2 emissions in 2018, at 45 percent of all energy-related carbon dioxide emissions. Transportation, heating, and electric power generation sectors consume significant amounts of petroleum. EIA projects petroleum
CO2 emissions will remain relatively flat in 2019, relative to 2018.
According to EIA, nearly all of its forecast decrease for 2019 is due to reduced emissions from coal
consumption. EIA forecasts that coal-derived CO2 emissions will decrease by 169 million metric tons (MMmt) in
2019. This represents the largest year-over-year decrease in coal-derived CO2 emissions since 2015. Nearly all the coal used in the U.S. -- 92 percent -- is consumed by the electric power sector; EIA attributes the decline to forecast changes in the electricity generation mix, with coal plants retiring and relatively milder summer weather expected to lead to overall lower electricity demand.
While coal-related emissions are projected to decline, EIA projects that forecast natural gas CO2 emissions will increase by 53 MMmt, largely due to increased use of natural gas to displace coal for electric power generation. According to EIA, the decrease in coal emissions will more than outweigh the increase in natural gas emissions, because natural gas-fired
electricity generation is less carbon-intensive than coal-fired
electricity generation.

Energy powers society; society's choices shape energy policy. A blog about our energy resources and the choices they present for society.
Showing posts with label EIA. Show all posts
Showing posts with label EIA. Show all posts

U.S. to export more energy by 2020 than it imports, projects EIA
Tuesday, January 29, 2019
Federal energy analysts project that the United States will export more energy than it imports by 2020, making the nation a net energy exporter for the first time since the 1950s. Fossil fuels represent the largest volumes of this international trade.
The United States both exports and imports energy in a variety of forms, including natural gas, coal and coke, petroleum and other liquids, and electricity. According to the U.S. Energy Information Administration, the United States has long been a net exporter of coal and coke. In 2017, the nation began exporting more natural gas than it imports, primarily in the form of liquified natural gas or LNG. EIA notes that electricity trades with neighboring Canada and Mexico represent "a relatively small part of U.S. net energy trade flows."
The EIA projects that domestic production of crude oil, natural gas, and natural gas plant liquids will continue to grow at a faster rate than U.S. energy consumption over the next decade, meaning the balance of these fuels will be exported. EIA projects that due to "evolving trade flows of liquid fuels and natural gas," increasing exports of these fuels will tip the trade balance to where the U.S. is a net exporter of energy by 2020. When this shift occurs, it will represent the first time that the United States exports more energy than it imports on an annual basis since 1953.
Exactly how large the nation's net exports might be -- and how long the net-exporter status might last -- depend on a variety of assumptions about matters including oil and gas prices, resource extraction technologies, and possible changes to law. Under EIA's reference case which reflects current laws and regulations, the U.S. begins exporting more energy than it imports on an annual basis in 2020 and maintains that status through 2050. In other cases featuring lower prices or extraction rates for oil and gas, EIA projects that U.S. will return to net-importer status by the mid- to late-2030s.
Changes to laws and regulations could also affect the trade balance for energy products.
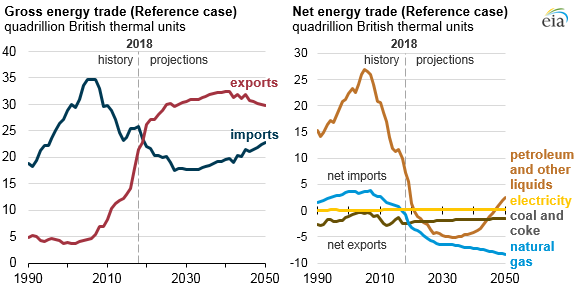 |
| Source: U.S. Energy Information Administration |
The EIA projects that domestic production of crude oil, natural gas, and natural gas plant liquids will continue to grow at a faster rate than U.S. energy consumption over the next decade, meaning the balance of these fuels will be exported. EIA projects that due to "evolving trade flows of liquid fuels and natural gas," increasing exports of these fuels will tip the trade balance to where the U.S. is a net exporter of energy by 2020. When this shift occurs, it will represent the first time that the United States exports more energy than it imports on an annual basis since 1953.
Exactly how large the nation's net exports might be -- and how long the net-exporter status might last -- depend on a variety of assumptions about matters including oil and gas prices, resource extraction technologies, and possible changes to law. Under EIA's reference case which reflects current laws and regulations, the U.S. begins exporting more energy than it imports on an annual basis in 2020 and maintains that status through 2050. In other cases featuring lower prices or extraction rates for oil and gas, EIA projects that U.S. will return to net-importer status by the mid- to late-2030s.
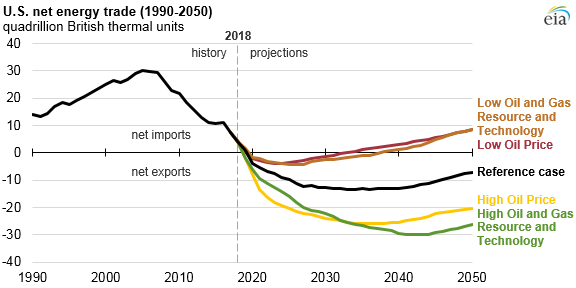 |
| Source: U.S. Energy Information Administration |
EIA says 2016 U.S. energy expenditures declined to lowest share of GDP since 1970
Thursday, January 24, 2019
According to the most recent data released by the U.S. Energy Information Administration, in 2016, U.S. energy expenditures declined for the fifth consecutive year, reaching $1.0 trillion in 2016. This represents a 9% decrease in real terms from 2015.
Adjusted for inflation, total energy expenditures in 2016 were the lowest since 2003. Expressed as a percent of gross domestic product (GDP), total energy expenditures were 5.6% in 2016, the lowest share of GDP since at least 1970. According to EIA, contributing factors include steady annual increases in GDP since 2010, coupled with steady annual decreases in total energy expenditures since 2011.
Meanwhile, annual total U.S. energy consumption has remained virtually flat since 2013. So the recent decreases in total energy expenditures are generally the result of lower energy prices. But EIA says it doesn’t expect this trend to continue, as average energy prices of products such as motor gasoline, natural gas, and retail electricity have all increased since 2016.
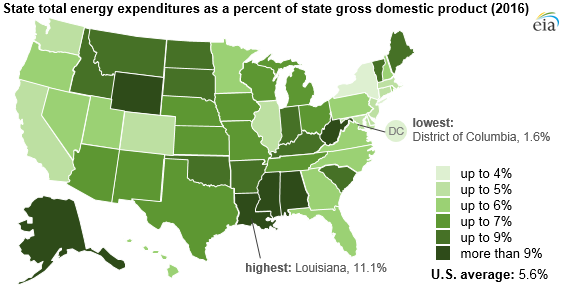
EIA also notes significant geographic variation in state total energy expenditures as a percent of state GDP. In 2016, Louisiana led the pack as it has every year since EIA started tracking this metric in 1997, with 2016 energy expenditures per GDP of 11.1% in 2016. EIA points to Louisiana’s large industrial sector consumption, including its energy-intensive petrochemical industry, as the biggest piece of the explanation.
But even while leading the nation, Louisiana set its own record-low ratio of energy expenditures per GDP, at a level that was less than half of the state’s previous high (26.5%) which was reached in 2008. Meanwhile, District of Columbia (1.6%), New York (3.3%), Massachusetts (4.3%), California (4.3%), and Delaware (4.4%) had the lowest energy expenditures per GDP in 2016. EIA says this reflects relatively high consumption in less energy-intensive residential and commercial sectors as well as relatively high state GDP.
Adjusted for inflation, total energy expenditures in 2016 were the lowest since 2003. Expressed as a percent of gross domestic product (GDP), total energy expenditures were 5.6% in 2016, the lowest share of GDP since at least 1970. According to EIA, contributing factors include steady annual increases in GDP since 2010, coupled with steady annual decreases in total energy expenditures since 2011.
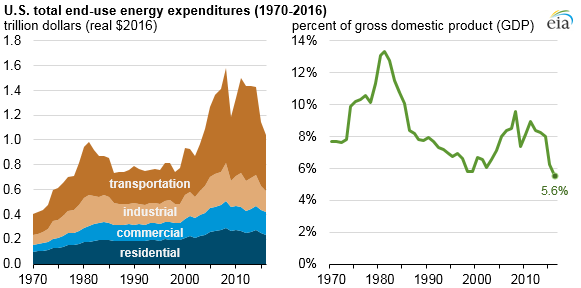 | ||
| Source: EIA, "In 2016, U.S. energy expenditures per unit GDP were the lowest since at least 1970" |
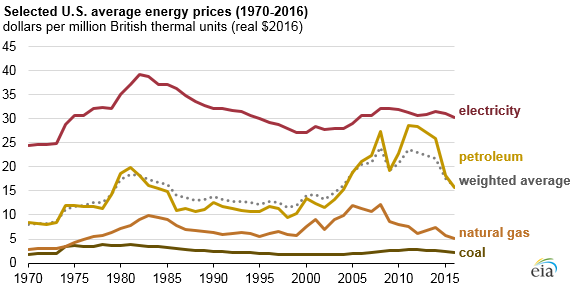 |
| Source: EIA, "In 2016, U.S. energy expenditures per unit GDP were the lowest since at least 1970" |
 |
| Source: EIA, "In 2016, U.S. energy expenditures per unit GDP were the lowest since at least 1970" |
But even while leading the nation, Louisiana set its own record-low ratio of energy expenditures per GDP, at a level that was less than half of the state’s previous high (26.5%) which was reached in 2008. Meanwhile, District of Columbia (1.6%), New York (3.3%), Massachusetts (4.3%), California (4.3%), and Delaware (4.4%) had the lowest energy expenditures per GDP in 2016. EIA says this reflects relatively high consumption in less energy-intensive residential and commercial sectors as well as relatively high state GDP.
FERC 2015 report on demand response, advanced metering
Monday, December 21, 2015
Staff of the Federal Energy Regulatory Commission have released their tenth
annual report on demand response and advanced metering. The FERC staff report, 2015 Assessment of Demand Response and Advanced Metering, provides an update on deployment of demand response and advanced metering.
Section 1252(e)(3) of Energy Policy Act of 2005 (EPAct 2005) directed the FERC to prepare and publish an annual report covering six sets of items:
Based on 2013 data from the Energy Information Administration, the report suggests a 37.6 percent overall penetration rate. It also shows a slightly higher percentage of residential customers have an advanced meter (37.8 percent) than do customers in the commercial (36.1 percent) or industrial (35.2 percent) customer classes.
At the same time, the FERC report shows a 4.9 percent drop in nationwide total potential peak reduction from retail demand response programs between 2012 and 2013, or a drop of 1,408 MW of demand response capability. It also notes legal uncertainty over FERC’s final rule on demand response compensation in organized wholesale electric markets, Order No. 745, given that the U.S. Court of Appeals for the D.C. Circuit vacated and remanded that order in Electric Power Supply Association v. FERC, No. 11-1486 (D.C. Cir. May 23, 2014). FERC's appeal of the EPSA v. FERC decision is now pending before the U.S. Supreme Court, with a final decision expected in early 2016.
Section 1252(e)(3) of Energy Policy Act of 2005 (EPAct 2005) directed the FERC to prepare and publish an annual report covering six sets of items:
- saturation and penetration rate of advanced meters and communications technologies, devices and systems;
- existing demand response programs and time-based rate programs;
- the annual resource contribution of demand resources;
- the potential for demand response as a quantifiable, reliable resource for regional planning purposes;
- steps taken to ensure that, in regional transmission planning and operations, demand resources are provided equitable treatment as a quantifiable, reliable resource relative to the resource obligations of any load - serving entity, transmission provider, or transmitting party; and
- regulatory barriers to improved customer participation in demand response, peak reduction and critical period pricing programs.
Based on 2013 data from the Energy Information Administration, the report suggests a 37.6 percent overall penetration rate. It also shows a slightly higher percentage of residential customers have an advanced meter (37.8 percent) than do customers in the commercial (36.1 percent) or industrial (35.2 percent) customer classes.
At the same time, the FERC report shows a 4.9 percent drop in nationwide total potential peak reduction from retail demand response programs between 2012 and 2013, or a drop of 1,408 MW of demand response capability. It also notes legal uncertainty over FERC’s final rule on demand response compensation in organized wholesale electric markets, Order No. 745, given that the U.S. Court of Appeals for the D.C. Circuit vacated and remanded that order in Electric Power Supply Association v. FERC, No. 11-1486 (D.C. Cir. May 23, 2014). FERC's appeal of the EPSA v. FERC decision is now pending before the U.S. Supreme Court, with a final decision expected in early 2016.
U.S. renewable energy share highest since 1930s
Tuesday, July 21, 2015
In 2014, about 9.8% of the total energy consumed in the U.S. came from renewable energy sources, according to the U.S. Energy Information Administration. This represents the highest share of total domestic energy supply coming from renewable resources since the 1930s.
Prior to the growth of production and distribution networks for petroleum and other fossil fuels in the early 20th century, many homes used wood for heating as did industry. This reliance on renewable biomass historically satisfied a significant portion of the total domestic energy demand. But technological advances and the birth of the electric power industry led to greater use of other fuels. As a result, the EIA reports that renewable resources' share of total domestic energy supply peaked in the 1930s, then declined.
But recent growth in U.S. renewable energy use has brought the country's energy mix back to nearly 10% renewable. Indeed, from 2001 to 2014, renewable energy use grew an average of 5% per year, largely through increased use of wind, solar, and biofuels:
Prior to the growth of production and distribution networks for petroleum and other fossil fuels in the early 20th century, many homes used wood for heating as did industry. This reliance on renewable biomass historically satisfied a significant portion of the total domestic energy demand. But technological advances and the birth of the electric power industry led to greater use of other fuels. As a result, the EIA reports that renewable resources' share of total domestic energy supply peaked in the 1930s, then declined.
But recent growth in U.S. renewable energy use has brought the country's energy mix back to nearly 10% renewable. Indeed, from 2001 to 2014, renewable energy use grew an average of 5% per year, largely through increased use of wind, solar, and biofuels:
- Wind energy grew from 70 trillion Btu in 2001 to more than 1,700 trillion Btu in 2014.
- Solar energy (solar thermal and photovoltaic) grew from 64 trillion Btu to 427 trillion Btu.
- The use of biomass for the production of biofuels grew from 253 trillion Btu to 2,068 trillion Btu.
Coal power plants retiring in 2015
Thursday, May 21, 2015
The U.S. portfolio of electric power plants will continue to shift in 2015, according to a federal assessment projecting that nearly 16 gigawatts (GW) of generating capacity will retire in 2015. Most of the capacity to be retired this year is coal-fired generation. This continues a multi-year trend away from coal, and toward natural gas and renewable resources.
According to the U.S. Energy Information Administration, nearly 16 GW of generating capacity is expected to retire in 2015. Of this, 81% (12.9 GW) is coal-fired generation. Generator retirements are heavily composed of coal-fired generation, split between bituminous coal (10.2 GW) and subbituminous coal (2.8 GW). Most of this retiring coal capacity is found in the Appalachian region, with slightly more than 8 GW combined in Ohio, West Virginia, Kentucky, Virginia, and Indiana.
New environmental regulations and struggles to remain cost-competitive explain most of these retirements. This year, the Environmental Protection Agency's Mercury and Air Toxics Standards (MATS) take effect. MATS requires existing large coal- and oil-fired electric generators to meet stricter emissions standards by retrofitting the units with new emissions control technologies. While some units have been granted extensions to operate through April 2016, some power plant operators are choosing to retire units instead of making cost-prohibitive investments in pollution control.
Most of the coal-fired units slated for retirement are smaller and operate at a lower capacity factor than average coal-fired units in the United States. According to EIA, the to-be-retired units have an average summer nameplate capacity of 158 MW, just 60% as big as the 261 MW average for other coal-fired units. In 2014, the average capacity factor for all coal units was 61%, but the subset of coal units retiring in 2015 had an average capacity factor of just 36%. The relatively small size and low capacity factor of these power plants make it harder for them to compete economically against other generation sources. This competition is especially difficult if sufficient natural gas-fired generating capacity is available, as the cost of natural gas has fallen to levels not seen since 2012.
The coal capacity retiring in 2015 accounted for 1.6% of total U.S. generation during 2014. At the same time, electric generating companies expect to add more than 20 GW of utility-scale generating capacity to the power grid. This new capacity is dominated by wind (9.8 GW), natural gas (6.3 GW), and solar (2.2 GW), which together compose 91% of expected new capacity in 2015.
According to the U.S. Energy Information Administration, nearly 16 GW of generating capacity is expected to retire in 2015. Of this, 81% (12.9 GW) is coal-fired generation. Generator retirements are heavily composed of coal-fired generation, split between bituminous coal (10.2 GW) and subbituminous coal (2.8 GW). Most of this retiring coal capacity is found in the Appalachian region, with slightly more than 8 GW combined in Ohio, West Virginia, Kentucky, Virginia, and Indiana.
New environmental regulations and struggles to remain cost-competitive explain most of these retirements. This year, the Environmental Protection Agency's Mercury and Air Toxics Standards (MATS) take effect. MATS requires existing large coal- and oil-fired electric generators to meet stricter emissions standards by retrofitting the units with new emissions control technologies. While some units have been granted extensions to operate through April 2016, some power plant operators are choosing to retire units instead of making cost-prohibitive investments in pollution control.
Most of the coal-fired units slated for retirement are smaller and operate at a lower capacity factor than average coal-fired units in the United States. According to EIA, the to-be-retired units have an average summer nameplate capacity of 158 MW, just 60% as big as the 261 MW average for other coal-fired units. In 2014, the average capacity factor for all coal units was 61%, but the subset of coal units retiring in 2015 had an average capacity factor of just 36%. The relatively small size and low capacity factor of these power plants make it harder for them to compete economically against other generation sources. This competition is especially difficult if sufficient natural gas-fired generating capacity is available, as the cost of natural gas has fallen to levels not seen since 2012.
The coal capacity retiring in 2015 accounted for 1.6% of total U.S. generation during 2014. At the same time, electric generating companies expect to add more than 20 GW of utility-scale generating capacity to the power grid. This new capacity is dominated by wind (9.8 GW), natural gas (6.3 GW), and solar (2.2 GW), which together compose 91% of expected new capacity in 2015.
New generation in 2014 mostly gas, solar, wind
Wednesday, September 17, 2014
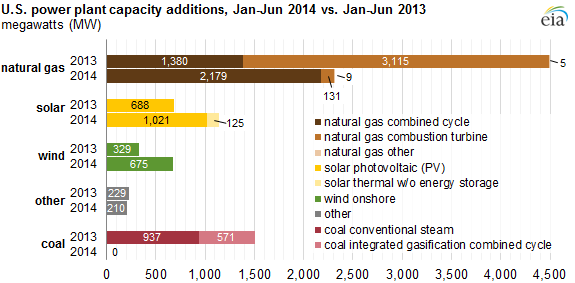
Most new power plants placed in service in the first half of 2014 are powered by natural gas, with new solar and wind capacity coming in second and third, respectively, according to the U.S. Energy Information Administration. Meanwhile, no new coal-fired electric generating capacity was added during that period.
From January through June 2014, EIA data shows the U.S. added 4,350 megawatts of new
utility-scale generating capacity. Combined-cycle natural gas plants contributed 2,179 MW of new capacity. Of this, over half is located at Florida Power & Light's Riviera Beach Next Generation Clean Energy Center in Florida. New combustion turbine plants added another 131 MW. In all, natural gas powers over 53% of new capacity coming online in the first half of 2014. Most of the nation has access to low cost natural gas, which offers significant environmental benefits over other fossil fuels like coal and oil.
Solar projects came in second, with 1,146 MW of new capacity coming online. Solar capacity is growing quickly, with an increase of almost 70% in new capacity added over the same period in 2013. Nearly 75% of this solar capacity is located in California, with most of the rest in Arizona, Nevada, and Massachusetts. Notably, the EIA's data only covers utility-scale projects; it omits most rooftop solar projects and any other solar capacity additions below 1 MW in size.
New wind capacity came in third, with 675 MW added. Most of the new capacity is sited in California, Nebraska, Michigan, and Minnesota.
Coal was notably absent from the ranks of new generating capacity added in the first half of 2014. New coal plants face steep headwinds in the form of environmental regulations and stiff competition against natural gas plants. EIA reports that only two coal plants are planned to come online in 2014.
As regulations and market forces shape the nation's energy mix, where will the new equilibrium be found -- and for how long?
 |
| Source: U.S. Energy Information Administration, Electric Power Monthly, August 2014 edition with June 2014 data Note: Data include facilities with a net summer capacity of 1 MW and above only. |
Solar projects came in second, with 1,146 MW of new capacity coming online. Solar capacity is growing quickly, with an increase of almost 70% in new capacity added over the same period in 2013. Nearly 75% of this solar capacity is located in California, with most of the rest in Arizona, Nevada, and Massachusetts. Notably, the EIA's data only covers utility-scale projects; it omits most rooftop solar projects and any other solar capacity additions below 1 MW in size.
New wind capacity came in third, with 675 MW added. Most of the new capacity is sited in California, Nebraska, Michigan, and Minnesota.
Coal was notably absent from the ranks of new generating capacity added in the first half of 2014. New coal plants face steep headwinds in the form of environmental regulations and stiff competition against natural gas plants. EIA reports that only two coal plants are planned to come online in 2014.
As regulations and market forces shape the nation's energy mix, where will the new equilibrium be found -- and for how long?
Report projects modest need for electric generation capacity growth
Thursday, July 24, 2014
The U.S. Energy Information Administration has projected that 351 gigawatts of new electric generating capacity will be added to the U.S. grid between 2013 and 2040. This projected new capacity, most of which EIA expects to be fueled by natural gas, will replace older power plants as they retire, as well as modestly increasing the country's net installed capacity.
EIA's forecast implies a growth rate well below recent annual levels observed. Under EIA's projection, capacity additions through 2016 will average 16 GW per year. But from 2017 through 2022, EIA expects additions of less than 9 GW per year as the existing generating fleet will be sufficient to meet expected demand growth in most regions. From 2025 to 2040, annual additions increase to an average 14 GW per year, but remain below recent levels.
EIA expects that natural gas will be the primary fuel source for the projected added capacity, accounting for 73% of capacity additions in the reference case (or 255 GW).
Renewables will account for 24% of the new capacity (or 83 MW). Of renewable capacity additions, 39 GW are solar photovoltaic (PV) systems (60% of which are rooftop installations). Another 28 GW are wind, most of which will occur by 2015 to qualify for federal renewable energy production tax credits).
New nuclear capacity will total about 3% (or 10 GW), including 6 GW of plants currently under construction and 4 GW projected after 2027.
EIA also projects that 1% of capacity additions (or less than 3 GW) will come from coal, with more than 80% of that total currently under construction. EIA notes that federal and state environmental regulations and uncertainty about future limits on greenhouse gas emissions reduce the attractiveness and economic merits of coal-fired plants.
Like any forecast, EIA's projections rest upon a series of assumptions. Under alternative cases, we might experience actual capacity additions that differ from EIA's forecasts. Nevertheless, the EIA Annual Energy Outlook 2014 offers a glimpse of changes to the portfolio composing our energy mix may come in the next decades.
EIA's forecast implies a growth rate well below recent annual levels observed. Under EIA's projection, capacity additions through 2016 will average 16 GW per year. But from 2017 through 2022, EIA expects additions of less than 9 GW per year as the existing generating fleet will be sufficient to meet expected demand growth in most regions. From 2025 to 2040, annual additions increase to an average 14 GW per year, but remain below recent levels.
EIA expects that natural gas will be the primary fuel source for the projected added capacity, accounting for 73% of capacity additions in the reference case (or 255 GW).
Renewables will account for 24% of the new capacity (or 83 MW). Of renewable capacity additions, 39 GW are solar photovoltaic (PV) systems (60% of which are rooftop installations). Another 28 GW are wind, most of which will occur by 2015 to qualify for federal renewable energy production tax credits).
New nuclear capacity will total about 3% (or 10 GW), including 6 GW of plants currently under construction and 4 GW projected after 2027.
EIA also projects that 1% of capacity additions (or less than 3 GW) will come from coal, with more than 80% of that total currently under construction. EIA notes that federal and state environmental regulations and uncertainty about future limits on greenhouse gas emissions reduce the attractiveness and economic merits of coal-fired plants.
Like any forecast, EIA's projections rest upon a series of assumptions. Under alternative cases, we might experience actual capacity additions that differ from EIA's forecasts. Nevertheless, the EIA Annual Energy Outlook 2014 offers a glimpse of changes to the portfolio composing our energy mix may come in the next decades.
US energy consumers paid $14 billion more last winter
Tuesday, May 27, 2014
U.S. consumers paid $14 billion more for their energy needs during the winter of 2013-2014 compared to the previous winter, according to a report by the U.S. Energy Information Administration.
The cost of energy affects people and businesses across the country. Consumers are affected by both the price they pay per unit of electricity or fuel for transportation and heating and the volume of each energy commodity they demand. In much of the U.S., demand for energy increases during winter months. The winter season often sees prices increase as well, as more expensive supply is needed to meet consumer demand.
The winter of 2013-2014 was no exception, according to the EIA's data. U.S. consumers spent $14 billion more for energy during the fourth quarter of 2013 and first quarter of 2014 compared to the previous winter. This amounts to an increase of 4.4%, or a 0.1% increase when measured as a share of disposable income.
The biggest drivers of the increase in consumer energy costs were higher expenditures for electricity, natural gas, heating oil and propane. Electricity expenditures increased $7.9 billion, or 10%, last winter compared with the previous winter. Much of the increased cost of electricity came as a result of increased costs for natural gas, a key fuel used for electric power generation. Constraints on interstate natural gas pipelines drive fuel prices up as demand increases. Throughout much of the northeast region, interstate natural gas pipelines reach their maximum flow rates on an increasing number of winter days. When the pipelines begin to fill, the price of natural gas delivered into the constrained region increases. Ultimately, when the pipelines have reached their maximum capacity, no more natural gas can be bought at any price.
The price of natural gas also affects consumers directly, as consumers also rely upon natural gas for space heating and applications like drying. EIA's data show that consumer expenditures for natural gas increased by $5.8 billion, or 16%, last winter compared with the previous winter.
Expenditures for the other major heating fuels -- oil and propane -- also increased by $6.0 billion, or 27%, over the previous winter. As EIA notes, heating oil and propane are used predominantly for space heating and are used to heat a relatively small number of homes, but their use is concentrated in the Northeast -- the area of the country that experienced the coldest weather this winter. Propane consumers experienced not only price spikes but even shortages during the coldest parts of the season.
As costly as the past winter was, the increase in consumer energy costs would have been even higher if transportation-related costs had not decreased significantly. In fact, transportation accounts for the largest single share of U.S. consumers' energy budget -- often over two-thirds of energy expenditures during the summer driving season, and over half of energy expenditures even in the winter. But transportation fuel expenses decreased by $5.8 billion, or 3%, last winter compared with the previous winter. EIA cites reductions in demand for gasoline due to winter storms that reduced driving.
Weather is a significant factor affecting winter energy costs -- but policies and infrastructure also play major roles in shaping consumers' energy expenditures. What will next winter bring?
The cost of energy affects people and businesses across the country. Consumers are affected by both the price they pay per unit of electricity or fuel for transportation and heating and the volume of each energy commodity they demand. In much of the U.S., demand for energy increases during winter months. The winter season often sees prices increase as well, as more expensive supply is needed to meet consumer demand.
The winter of 2013-2014 was no exception, according to the EIA's data. U.S. consumers spent $14 billion more for energy during the fourth quarter of 2013 and first quarter of 2014 compared to the previous winter. This amounts to an increase of 4.4%, or a 0.1% increase when measured as a share of disposable income.
The biggest drivers of the increase in consumer energy costs were higher expenditures for electricity, natural gas, heating oil and propane. Electricity expenditures increased $7.9 billion, or 10%, last winter compared with the previous winter. Much of the increased cost of electricity came as a result of increased costs for natural gas, a key fuel used for electric power generation. Constraints on interstate natural gas pipelines drive fuel prices up as demand increases. Throughout much of the northeast region, interstate natural gas pipelines reach their maximum flow rates on an increasing number of winter days. When the pipelines begin to fill, the price of natural gas delivered into the constrained region increases. Ultimately, when the pipelines have reached their maximum capacity, no more natural gas can be bought at any price.
The price of natural gas also affects consumers directly, as consumers also rely upon natural gas for space heating and applications like drying. EIA's data show that consumer expenditures for natural gas increased by $5.8 billion, or 16%, last winter compared with the previous winter.
Expenditures for the other major heating fuels -- oil and propane -- also increased by $6.0 billion, or 27%, over the previous winter. As EIA notes, heating oil and propane are used predominantly for space heating and are used to heat a relatively small number of homes, but their use is concentrated in the Northeast -- the area of the country that experienced the coldest weather this winter. Propane consumers experienced not only price spikes but even shortages during the coldest parts of the season.
As costly as the past winter was, the increase in consumer energy costs would have been even higher if transportation-related costs had not decreased significantly. In fact, transportation accounts for the largest single share of U.S. consumers' energy budget -- often over two-thirds of energy expenditures during the summer driving season, and over half of energy expenditures even in the winter. But transportation fuel expenses decreased by $5.8 billion, or 3%, last winter compared with the previous winter. EIA cites reductions in demand for gasoline due to winter storms that reduced driving.
Weather is a significant factor affecting winter energy costs -- but policies and infrastructure also play major roles in shaping consumers' energy expenditures. What will next winter bring?
U.S. natural gas to pass coal as electricity fuel in 2035
Thursday, May 15, 2014
Coal will continue to fuel the largest share of electricity generated in the U.S. until 2035, when natural gas will surpass it, according to a recent federal report.
The U.S. Energy Information Administration's 2014 Annual Energy Outlook presents a long-term forecast of energy supply, demand, and prices from the present through 2040. Its scope includes predictions about shifts in the portfolio of types of electricity generating resources used to produce power. The largest such trend projected in EIA's 2014 report is that the market share of coal and nuclear generators will likely decline over the next two decades, as natural gas-fired and renewable electricity sources grow in prominence.
Historically, coal has fueled the largest share of electricity generated in the U.S. Typically operating as baseload generation, coal has traditionally been a relatively low-cost fuel for electric production. Coal's share of the electricity mix peaked in 2007, at 49% of all electric power generated. Since then, coal's share has declined; in 2012, coal-fired generators produced 39% of all electricity generated by utilities -- still the largest piece of the generation portfolio, despite a significant decline.
Coal's role in the nation's energy mix is under challenge from multiple fronts. Economically, the increased availability of lower-cost natural gas has made coal less competitive. Meanwhile, tighter environmental regulations -- such as the U.S. Environmental Protection Agency's Mercury and Air Toxics Standards, or MATS rules -- have placed additional pressure on coal plant operators to either invest in upgraded environmental controls or shut down.
At the end of 2012, 310 gigawatts of coal-fired generating capacity was available to run in the U.S. Of that, EIA projects that 50 gigawatts will be retired by 2020 under its base case model.
Under EIA's model, natural gas will grow its market share while coal declines. EIA projects that 70% of all new capacity added before 2040 will be fueled by natural gas. If EIA's assumptions hold, natural gas will surpass coal as a fuel for electricity generation in 2035.
While EIA's model rests on a series of assumptions, all of the alternative cases examined by EIA assume that coal-fired capacity will be retired, while natural gas-fired and renewable generation will grow. What will the future hold for the U.S. energy mix?
The U.S. Energy Information Administration's 2014 Annual Energy Outlook presents a long-term forecast of energy supply, demand, and prices from the present through 2040. Its scope includes predictions about shifts in the portfolio of types of electricity generating resources used to produce power. The largest such trend projected in EIA's 2014 report is that the market share of coal and nuclear generators will likely decline over the next two decades, as natural gas-fired and renewable electricity sources grow in prominence.
Historically, coal has fueled the largest share of electricity generated in the U.S. Typically operating as baseload generation, coal has traditionally been a relatively low-cost fuel for electric production. Coal's share of the electricity mix peaked in 2007, at 49% of all electric power generated. Since then, coal's share has declined; in 2012, coal-fired generators produced 39% of all electricity generated by utilities -- still the largest piece of the generation portfolio, despite a significant decline.
Coal's role in the nation's energy mix is under challenge from multiple fronts. Economically, the increased availability of lower-cost natural gas has made coal less competitive. Meanwhile, tighter environmental regulations -- such as the U.S. Environmental Protection Agency's Mercury and Air Toxics Standards, or MATS rules -- have placed additional pressure on coal plant operators to either invest in upgraded environmental controls or shut down.
At the end of 2012, 310 gigawatts of coal-fired generating capacity was available to run in the U.S. Of that, EIA projects that 50 gigawatts will be retired by 2020 under its base case model.
Under EIA's model, natural gas will grow its market share while coal declines. EIA projects that 70% of all new capacity added before 2040 will be fueled by natural gas. If EIA's assumptions hold, natural gas will surpass coal as a fuel for electricity generation in 2035.
While EIA's model rests on a series of assumptions, all of the alternative cases examined by EIA assume that coal-fired capacity will be retired, while natural gas-fired and renewable generation will grow. What will the future hold for the U.S. energy mix?
EIA releases 2014 Annual Energy Outlook
Wednesday, May 14, 2014
The U.S. Energy Information Administration has released its annual report projecting long-term trends in energy markets.
The Energy Information Administration, or EIA, is the statistical and analytical agency within the U.S. Department of Energy. Its 2014 Annual Energy Outlook (269-page PDF) presents long-term annual projections of energy supply, demand, and prices focused on the U.S. through 2040. Based on data-driven models, the report considers a reference case under which it assumes current laws and regulations remain unchanged, as well as alternative cases that explore important areas of uncertainty for markets, technologies, and policies in the U.S. energy economy.
The report's biggest findings include projections that:
How will EIA's projections fare over the coming years?
The Energy Information Administration, or EIA, is the statistical and analytical agency within the U.S. Department of Energy. Its 2014 Annual Energy Outlook (269-page PDF) presents long-term annual projections of energy supply, demand, and prices focused on the U.S. through 2040. Based on data-driven models, the report considers a reference case under which it assumes current laws and regulations remain unchanged, as well as alternative cases that explore important areas of uncertainty for markets, technologies, and policies in the U.S. energy economy.
The report's biggest findings include projections that:
- Growing domestic production of natural gas and oil continues to reshape the U.S. energy economy, largely as a result of rising production from tight formations, but the effect could vary substantially depending on expectations about resources and technology.
- Industrial production expands over the next 10 to 15 years as the competitive advantage of low natural gas prices provides a boost to the industrial sector with increasing natural gas use.
- There is greater upside uncertainty than downside uncertainty in oil and natural gas production; higher production could spur even more industrial growth and lower the use of imported petroleum.
- Improvement in light-duty vehicle (LDV) efficiency more than offsets modest growth in vehicle miles traveled (VMT) that reflects changing driving patterns, leading to a sharp decline in LDV energy use.
- Evolving natural gas markets spur increased use of natural gas for electricity generation and transportation, as well as expanded export opportunities.
- Improved efficiency of energy use in the residential and transportation sectors and a shift away from more carbon-intensive fuels such as coal for electricity generation help to stabilize U.S. energy-related carbon dioxide (CO2) emissions.
How will EIA's projections fare over the coming years?
Predictions for renewable energy in 2013
Tuesday, October 8, 2013
With under three months left in 2013, we will soon learn whether this year's projections for the energy industry prove accurate. The U.S. Energy Information Administration publishes a series of short-term energy outlook reports covering crude oil and liquid fuels, natural gas, coal, and electricity. What has EIA forecast for the year in renewable energy?
EIA projects a continued increase in the consumption of renewable energy in the forms of electricity and heat generation. Overall, in 2013 EIA expects 4.5% growth over 2012's renewable energy consumption, with further growth of 2.3% in 2014.
EIA also predicts shifts in the resource mix providing this renewable energy. In 2013, EIA expects a 1.5% decline in hydropower production, offset by 8.3% average growth of nonhydropower renewables used for electricity and heat generation. In particular, EIA expects 2.5% growth in wind capacity this year, reaching a total installed capacity of about 61 gigawatts from wind. This capacity is predicted to enable generation from wind to increase 19% in 2013 and another 2.4% in 2014, at which point it is expected to reach over 4% of all electricity generated in the U.S.
Solar energy is expected to grow more sharply, but will remain a relatively small segment of the nation's overall energy portfolio. EIA expects solar generation by the electric power sector to increase a staggering 79% in 2013 and 80% in 2014. In recent years, customer-sited distributed generation projects have led the charge in new capacity additions, but EIA expects utility-scale projects to more than double in total installed capacity between 2012 and 2014. Most of this new utility-scale solar capacity will continue to come from photovoltaics, but several large solar thermal generation projects may come online the next two years. Despite this relative growth, the small absolute size of the U.S. solar market means that solar energy will only account for about 0.3% of energy consumed in 2014.
When 2013 has ended, will EIA's predictions come true? We will learn in several months.
 |
| Fall foliage and solar photovoltaic panels at Cider Hill Farm in Amesbury, Massachusetts. |
EIA projects a continued increase in the consumption of renewable energy in the forms of electricity and heat generation. Overall, in 2013 EIA expects 4.5% growth over 2012's renewable energy consumption, with further growth of 2.3% in 2014.
EIA also predicts shifts in the resource mix providing this renewable energy. In 2013, EIA expects a 1.5% decline in hydropower production, offset by 8.3% average growth of nonhydropower renewables used for electricity and heat generation. In particular, EIA expects 2.5% growth in wind capacity this year, reaching a total installed capacity of about 61 gigawatts from wind. This capacity is predicted to enable generation from wind to increase 19% in 2013 and another 2.4% in 2014, at which point it is expected to reach over 4% of all electricity generated in the U.S.
Solar energy is expected to grow more sharply, but will remain a relatively small segment of the nation's overall energy portfolio. EIA expects solar generation by the electric power sector to increase a staggering 79% in 2013 and 80% in 2014. In recent years, customer-sited distributed generation projects have led the charge in new capacity additions, but EIA expects utility-scale projects to more than double in total installed capacity between 2012 and 2014. Most of this new utility-scale solar capacity will continue to come from photovoltaics, but several large solar thermal generation projects may come online the next two years. Despite this relative growth, the small absolute size of the U.S. solar market means that solar energy will only account for about 0.3% of energy consumed in 2014.
When 2013 has ended, will EIA's predictions come true? We will learn in several months.
Feds release June 2013 short-term energy outlook
Thursday, June 13, 2013
The U.S. Energy Information Administration has released its updated short-term energy outlook. The report describes recent trends in fuel and energy resource markets, and predicts future supply, demand, and prices. Highlights from the June 2013 report include:
EIA's projections are based on a variety of assumptions about the domestic and global economies, energy project development, and weather-related demand for energy products. EIA's next short-term energy outlook will be released on July 9, 2013.
- Gasoline prices to decrease: EIA predicts that the price of regular gasoline will average $3.53 per gallon over the summer driving season. Noting a decrease from 2012's annual average retail price of $3.63 per gallon, EIA predicts that gasoline will continue to decline in price to $3.49 per gallon in 2013 and to $3.37 per gallon in 2014. That said, EIA notes significant uncertainty about this forecast based in part on current values of futures and options contracts.
- Crude oil prices to decrease: EIA predicts similar decreases in the price of crude oil through 2014. Through much of the world, oil commodity pricing is based on the Brent crude price -- the price paid for a sweet light crude oil produced from Europe's North Sea fields. Spot pricing for Brent crude bounced around in the first 5 months of 2012, ranging from a low of $97 per barrel in April to a high of $119 per barrel in February. EIA expects a slow decrease in the Brent crude oil spot price, averaging $102 per barrel over the second half of 2013, and $100 per barrel in 2014.
- Electricity usage to decrease while prices increase: EIA's forecasts call for milder temperatures than last summer, driving air conditioning-related demand for electricity downward. At the same time, EIA expects a 2% increase in average prices for delivered electricity this summer. Last year, the U.S. residential electricity price averaged 11.9 cents per kWh. EIA expects this summer's average price to rise to 12.3 cents/kWh, with a 1.1 percent price increase in 2013 and a 1.9 percent in 2014.
EIA's projections are based on a variety of assumptions about the domestic and global economies, energy project development, and weather-related demand for energy products. EIA's next short-term energy outlook will be released on July 9, 2013.
Coal retakes the lead in US electric power generation
Friday, May 24, 2013
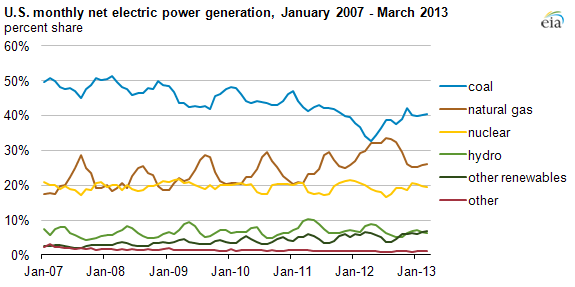
Coal has retaken its status as the leading fuel for electric power generation in the U.S., as both demand for electricity and natural gas prices increased. Preliminary U.S. Energy Information Administration data show that 40% or more of the nation's
electricity came from coal in each month between November 2012 and March 2013, with natural gas fueling
about 25% of generation during the same period. This is a partial reversal of the recent trend of natural gas replacing coal as a fuel for electric power generation.
Coal dominated electric power production for much of last century. From 2001 to 2008, coal powered between 48% and 51% of annual generation. But in the past four years, increased production of natural gas from shales and other unconventional resources led to lower natural gas prices. Combined with tighter environmental regulations on coal plants' air emissions, this led utilities and merchant generators to burn more natural gas and less coal. By April 2012, coal and natural gas each contributed an equal share of electric power.
EIA's most recent data suggests that trend is slowing or has partially reversed. For the five months from November 2012 through March 2013, more electricity was produced in the U.S. from coal than from natural gas. For example, in March, coal-fired units generated just 130,000 megawatt-hours of electricity, while natural gas units produced just under 85,000 megawatt-hours.
Coal's share of total U.S. electricity generation remains well below its historic range. Coal has not been responsible for 50% or more of power produced in any year since 2005, and the EIA's latest Short-Term Energy Outlook predicts that coal will contribute 40% of generation in 2013. Natural gas remains relatively inexpensive throughout most of the year in most of the country, but regions like New England suffer from higher natural gas prices in winter due to inadequate pipeline infrastructure into the region. Market forces and regulations will determine whether natural gas climbs back to parity with coal as a fuel for electric power generation.
Coal dominated electric power production for much of last century. From 2001 to 2008, coal powered between 48% and 51% of annual generation. But in the past four years, increased production of natural gas from shales and other unconventional resources led to lower natural gas prices. Combined with tighter environmental regulations on coal plants' air emissions, this led utilities and merchant generators to burn more natural gas and less coal. By April 2012, coal and natural gas each contributed an equal share of electric power.
EIA's most recent data suggests that trend is slowing or has partially reversed. For the five months from November 2012 through March 2013, more electricity was produced in the U.S. from coal than from natural gas. For example, in March, coal-fired units generated just 130,000 megawatt-hours of electricity, while natural gas units produced just under 85,000 megawatt-hours.
 |
| Chart courtesy of U.S. Energy Information Administration, available at http://www.eia.gov/todayinenergy/detail.cfm?id=11391/ |
Coal's share of total U.S. electricity generation remains well below its historic range. Coal has not been responsible for 50% or more of power produced in any year since 2005, and the EIA's latest Short-Term Energy Outlook predicts that coal will contribute 40% of generation in 2013. Natural gas remains relatively inexpensive throughout most of the year in most of the country, but regions like New England suffer from higher natural gas prices in winter due to inadequate pipeline infrastructure into the region. Market forces and regulations will determine whether natural gas climbs back to parity with coal as a fuel for electric power generation.
2012 natural gas wholesale prices fell 31%
Monday, January 14, 2013
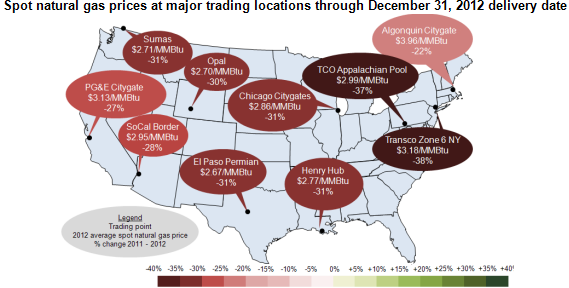
2012's biggest revolution in the energy sector may be the commercial availability of low-cost natural gas. Significant growth in the volume of shale gas produced by hydraulic fracturing, combined with mild demand for natural gas, resulted in 2012 average wholesale prices that were 31% below 2011 prices.
As a commodity, prices for natural gas are typically stated at a pricing point known as Henry Hub, a pipeline distribution hub in Erath, Louisiana. In 2011, the average price at Henry Hub was $4.02 per million British thermal units (MMBtu). In 2012, that price fell to $2.77 per MMBtu, the lowest average annual price at Henry Hub since 1999.
Overall, average annual prices for natural gas fell 30%-34% in 2012 compared to 2011 for buyers at most major trading points. The U.S. Energy Information Administration recently released this chart showing average spot prices for natural gas in 2012, and the percent change since 2011:
The historic low pricing is driven by several factors. Natural gas production was up 4% compared to 2011 levels, particularly from the Marcellus Shale and Eagle Ford basins. Gas inventories in storage remained high. At the same time, demand rose by 3%; increased use of natural gas for electric power generation was partially offset by a relatively mild winter.
What will 2013 hold for natural gas pricing?
Hurricane Isaac disrupts Gulf energy production
Tuesday, August 28, 2012
Hurricane Isaac has already disrupted energy production in the Gulf of Mexico -- and is likely to cause further damage when it makes landfall late tonight or tomorrow morning.
As I noted yesterday, the storm's path across the Gulf as Tropical Storm Isaac has already caused most oil and natural gas producers in the Gulf to shut in their wells; temporarily halting the production of these fuels from the Gulf. As of yesterday, producers had shut in 78% of Gulf oil production and 48% percent of natural gas production. Data released today by the federal Bureau of Safety and Environmental Enforcement shows about 93.28% of the current daily oil production in the Gulf of Mexico has been shut-in, as has about 66.7% of the current daily natural gas production in the Gulf.
Offshore hydrocarbon resources in the Gulf of Mexico play a significant role in U.S. fuel production. According to the U.S. Energy Information Administration (EIA), about 23% of all U.S. crude oil production comes from the Gulf, as does about 7% of U.S. dry natural gas production.
Subject to tropical storms and hurricanes, Gulf oil and gas production is periodically interrupted due to severe weather. For example, EIA data shows that at its peak, 2005's Hurricane Katrina caused producers to shut in 539,074 barrels of oil production per day -- about half the amount of shut-in production as Tropical Storm Isaac caused yesterday. EIA data also shows that up to 3,228 cubic feet per day of natural gas production was shut in as a result of Katrina, or about one-and-a-half times as much gas per day as has been shut in due to Isaac so far. Four months after Katrina hit, 2,155 oil and gas wells, or 36.2 percent of the wells in the region, reportedly remained shut-in and incapable of producing. Understanding the full comparative impact of these storms will require knowing when the production shut-in by Isaac can come back online, but it is clear that Hurricane Isaac is a force to be reckoned with.
Previous storms, such as Hurricane Katrina, also caused significant damage to onshore energy infrastructure like oil refineries. At its peak, Katrina reportedly caused 4.5 million barrels per day of refining capacity to be shuttered; four months later, refinery shutdowns in the Gulf of Mexico region still totaled 367,000 barrels per day.
In preparation for Hurricane Isaac's landfall, several large Gulf Coast refineries have announced closures, with estimates suggesting a total of 1.1 million barrels per day of shutdown refining capacity or about half of the refining in the storm's path. While Isaac is expected to remain a Category 1 hurricane, and thus may pack less of a punch than Category 3 Katrina, Isaac's impending landfall comes swiftly on the heels of a significant refinery explosion and fire in Venezuela. Consumers can expect gasoline prices to trend higher in the near term.
As I noted yesterday, the storm's path across the Gulf as Tropical Storm Isaac has already caused most oil and natural gas producers in the Gulf to shut in their wells; temporarily halting the production of these fuels from the Gulf. As of yesterday, producers had shut in 78% of Gulf oil production and 48% percent of natural gas production. Data released today by the federal Bureau of Safety and Environmental Enforcement shows about 93.28% of the current daily oil production in the Gulf of Mexico has been shut-in, as has about 66.7% of the current daily natural gas production in the Gulf.
Offshore hydrocarbon resources in the Gulf of Mexico play a significant role in U.S. fuel production. According to the U.S. Energy Information Administration (EIA), about 23% of all U.S. crude oil production comes from the Gulf, as does about 7% of U.S. dry natural gas production.
Subject to tropical storms and hurricanes, Gulf oil and gas production is periodically interrupted due to severe weather. For example, EIA data shows that at its peak, 2005's Hurricane Katrina caused producers to shut in 539,074 barrels of oil production per day -- about half the amount of shut-in production as Tropical Storm Isaac caused yesterday. EIA data also shows that up to 3,228 cubic feet per day of natural gas production was shut in as a result of Katrina, or about one-and-a-half times as much gas per day as has been shut in due to Isaac so far. Four months after Katrina hit, 2,155 oil and gas wells, or 36.2 percent of the wells in the region, reportedly remained shut-in and incapable of producing. Understanding the full comparative impact of these storms will require knowing when the production shut-in by Isaac can come back online, but it is clear that Hurricane Isaac is a force to be reckoned with.
Previous storms, such as Hurricane Katrina, also caused significant damage to onshore energy infrastructure like oil refineries. At its peak, Katrina reportedly caused 4.5 million barrels per day of refining capacity to be shuttered; four months later, refinery shutdowns in the Gulf of Mexico region still totaled 367,000 barrels per day.
In preparation for Hurricane Isaac's landfall, several large Gulf Coast refineries have announced closures, with estimates suggesting a total of 1.1 million barrels per day of shutdown refining capacity or about half of the refining in the storm's path. While Isaac is expected to remain a Category 1 hurricane, and thus may pack less of a punch than Category 3 Katrina, Isaac's impending landfall comes swiftly on the heels of a significant refinery explosion and fire in Venezuela. Consumers can expect gasoline prices to trend higher in the near term.
Hospital energy use in focus
Friday, August 24, 2012
Hospitals provide essential services to society - but many hospitals consume large amounts of energy in fulfilling their mission. Newly released data shows that large hospitals tend to consume more energy per square foot than do other commercial buildings.
The data released by the U.S. Energy Information Administration last week comes from the 2007 Commercial Buildings Energy Consumption Survey (CBECS). While 2007-vintage data may seem a bit stale in 2012, the 2007 survey results are the most recently-released from the CBECS program, providing an update to the 2003 survey. The survey considered the consumption of electricity, natural gas, fuel oil, and district heat (steam or hot water from an outside source used for heating) by a variety of types of commercial buildings.
According to EIA, the roughly 3,040 large hospitals operating in 2007 - defined as those over 200,000 square feet - consumed 458 trillion British thermal units (Btu) of energy in that year. Of this total energy budget, most came in the form of natural gas and electricity: 208 trillion Btu of natural gas, 194 trillion Btu of electricity, 6
trillion Btu of fuel oil, and 49 trillion Btu of district heat.
Altogether, large hospitals consumed about 5.5% of the commercial sector's total energy consumption in 2007. On a Btu per square foot basis, the EIA data suggests that large hospitals' energy intensity exceeds that of other commercial building types, with large hospitals accounting for only 2% of commercial floorspace in 2003.
This energy intensity may not be surprising: hospitals are typically open around the clock, have high demands for heating,
ventilation, and air conditioning, and are home to a variety of energy-intensive activities ranging from laundry and food service to sterilization and computer servers. Hospitals' need for a high degree of electric service reliability have led 95% of large hospitals to use energy for generating their own electricity, mostly in the form of fuel oil-fired emergency back-up generation.
At the same time, most hospitals' consciousness about their energy footprint has led them to pursue energy efficiency. The EIA data shows that most large hospitals have energy management and conservation plans, and use energy-saving products like compact fluorescent lights or sophisticated services to reduce their consumption of electricity.
Still, the EIA data suggests that large hospitals still have room for improvement. What more can hospitals do to reduce their energy footprint and its associated costs, while continuing to provide the services society demands?
EIA data on electricity generator costs
Monday, August 6, 2012
What does it cost to build a new power plant? The answer depends on the technology used and other factors - but the U.S. Energy Information Administration publishes a useful reference presenting its analysis of the so-called "overnight cost" of building new centralized electricity generation stations using a variety of technologies.
Each year, the EIA publishes an Annual Energy Outlook containing projections for the upcoming year. This outlook considers a variety of potential future outcomes based on factors like changes in the demand for electricity or variations in fuel pricing.
Underlying the outlook is a series of assumptions about factors including the demand for electricity. A document released last week by EIA looks at a variety of new central station electricity generating technologies, and provides cost and performance characteristics for each.
One section of the data focuses on the total overnight cost of new projects initiated in 2011, defined as the overnight capital cost including contingency factors, excluding regional multipliers, learning effects, and interest. According to EIA, advanced combustion turbines have the lowest overnight cost: $666 per kilowatt (in 2010 dollars). By contrast, municipal solid waste - landfill gas facilities have the highest overnight cost: $8,233 per kW. Other technologies fall between these two extremes.
Capital cost is only one piece of the puzzle; variable and fixed operations and maintenance costs also play a major role in the economics of electric generation. According to EIA, variable O&M costs range from zero per megawatt-hour (for onshore and offshore wind, and solar thermal and photovoltaic) to $14.70 per MWh for a conventional combustion turbine. Fixed O&M costs range from as low as $6.70 per kilowatt for advanced combustion turbines to as high as $378.76 per kW for MSW - landfill gas facilities.
Not every technology is appropriate for any given site, and economic considerations must be matched with environmental, siting, and other factors in choosing power plant technologies needed to meet consumer demand. EIA's data is also aggregated and analytically-derived, meaning individual projects will likely have capital or O&M costs that deviate from these averages. Nevertheless the EIA data illustrates some of the dynamics underlying our future energy mix - will we build facilities with low capital costs but higher O&M costs, more expensive facilities with lower O&M costs -- or can we find technologies that perform well in all categories?
Each year, the EIA publishes an Annual Energy Outlook containing projections for the upcoming year. This outlook considers a variety of potential future outcomes based on factors like changes in the demand for electricity or variations in fuel pricing.
Underlying the outlook is a series of assumptions about factors including the demand for electricity. A document released last week by EIA looks at a variety of new central station electricity generating technologies, and provides cost and performance characteristics for each.
One section of the data focuses on the total overnight cost of new projects initiated in 2011, defined as the overnight capital cost including contingency factors, excluding regional multipliers, learning effects, and interest. According to EIA, advanced combustion turbines have the lowest overnight cost: $666 per kilowatt (in 2010 dollars). By contrast, municipal solid waste - landfill gas facilities have the highest overnight cost: $8,233 per kW. Other technologies fall between these two extremes.
Capital cost is only one piece of the puzzle; variable and fixed operations and maintenance costs also play a major role in the economics of electric generation. According to EIA, variable O&M costs range from zero per megawatt-hour (for onshore and offshore wind, and solar thermal and photovoltaic) to $14.70 per MWh for a conventional combustion turbine. Fixed O&M costs range from as low as $6.70 per kilowatt for advanced combustion turbines to as high as $378.76 per kW for MSW - landfill gas facilities.
Not every technology is appropriate for any given site, and economic considerations must be matched with environmental, siting, and other factors in choosing power plant technologies needed to meet consumer demand. EIA's data is also aggregated and analytically-derived, meaning individual projects will likely have capital or O&M costs that deviate from these averages. Nevertheless the EIA data illustrates some of the dynamics underlying our future energy mix - will we build facilities with low capital costs but higher O&M costs, more expensive facilities with lower O&M costs -- or can we find technologies that perform well in all categories?
Corn, ethanol, drought, and demand
Thursday, July 12, 2012
Corn plays an important role in current United States transportation fuel policy - but environmental and economic factors are putting the pinch on corn ethanol producers.
The U.S. Renewable Fuel Standard program requires transportation fuel sold in the United States to contain at least a minimum volume of renewable fuel. This renewable fuel is generally ethanol, produced by fermenting sugars contained in plant feedstocks like sugar cane and sugar beets, or sugars produced by converting plant-based starches like corn starch. The program's goals include reducing greenhouse gas emissions from the transportation sector, reducing petroleum imports, and encouraging the development and expansion of the domestic renewable fuels sector.
In the U.S., more than 95 percent of operating ethanol plants reportedly use corn starch as their feedstock. According to the U.S. Department of Agriculture, U.S. farmers planted 96.4 million acres of corn this year, the highest corn acreage since 1937. Favorable field conditions this spring led to the quickest planting pace on record, with nearly all of the corn planted by May 20 and plants emerged by June 3.
This summer's high temperatures and widespread drought conditions - with nearly 56% of the area of the 48 contiguous states experiencing drought - have hurt the U.S. corn crop, resulting in reduced estimates for this year's crop. This anticipated reduction is driving corn prices up, with the commodity trading at over $7 per bushel (contrast a 2007 U.S. Energy Information Administration analysis of transportation biofuels assuming corn prices of about $2 per bushel). This price increase is cutting into ethanol producers' bottom line.
At the same time, transportation fuel consumers are driving less. Between increased fleet efficiency prompted by both governmental mandates and a natural desire to cut costs, and the overall slowdown in the national economy, overall demand for ethanol fuel has not grown at the pace previously projected.
According to Reuters, the average ethanol plant operating in Illinois is currently losing 32 cents on every gallon it produces. As a result, many ethanol plants are running below their production capacity, and several have announced planned closures. EIA data shows that ethanol production dropped 4% last week to 821,000 barrels per day, the lowest production rate since July 23, 2010.
Proponents of blending ethanol into transportation fuels point to its nature as a renewable biofuel, lower cost than gasoline, and ability to be produced domestically. Critics question the wisdom of converting a potential food crop into an energy commodity, as well as the economic and environmental consequences of current pro-ethanol policies. Whatever the ultimate outcome, the climatic and economic conditions affecting the corn ethanol industry may be calling into question the sustainability of the current system.
The U.S. Renewable Fuel Standard program requires transportation fuel sold in the United States to contain at least a minimum volume of renewable fuel. This renewable fuel is generally ethanol, produced by fermenting sugars contained in plant feedstocks like sugar cane and sugar beets, or sugars produced by converting plant-based starches like corn starch. The program's goals include reducing greenhouse gas emissions from the transportation sector, reducing petroleum imports, and encouraging the development and expansion of the domestic renewable fuels sector.
In the U.S., more than 95 percent of operating ethanol plants reportedly use corn starch as their feedstock. According to the U.S. Department of Agriculture, U.S. farmers planted 96.4 million acres of corn this year, the highest corn acreage since 1937. Favorable field conditions this spring led to the quickest planting pace on record, with nearly all of the corn planted by May 20 and plants emerged by June 3.
This summer's high temperatures and widespread drought conditions - with nearly 56% of the area of the 48 contiguous states experiencing drought - have hurt the U.S. corn crop, resulting in reduced estimates for this year's crop. This anticipated reduction is driving corn prices up, with the commodity trading at over $7 per bushel (contrast a 2007 U.S. Energy Information Administration analysis of transportation biofuels assuming corn prices of about $2 per bushel). This price increase is cutting into ethanol producers' bottom line.
At the same time, transportation fuel consumers are driving less. Between increased fleet efficiency prompted by both governmental mandates and a natural desire to cut costs, and the overall slowdown in the national economy, overall demand for ethanol fuel has not grown at the pace previously projected.
According to Reuters, the average ethanol plant operating in Illinois is currently losing 32 cents on every gallon it produces. As a result, many ethanol plants are running below their production capacity, and several have announced planned closures. EIA data shows that ethanol production dropped 4% last week to 821,000 barrels per day, the lowest production rate since July 23, 2010.
Proponents of blending ethanol into transportation fuels point to its nature as a renewable biofuel, lower cost than gasoline, and ability to be produced domestically. Critics question the wisdom of converting a potential food crop into an energy commodity, as well as the economic and environmental consequences of current pro-ethanol policies. Whatever the ultimate outcome, the climatic and economic conditions affecting the corn ethanol industry may be calling into question the sustainability of the current system.
How price predictions affect heating oil supply contracts
Wednesday, October 26, 2011
Nearly half the households in the northeastern region of the United States use heating oil to provide part or all of their space heating needs. While natural gas fuels furnaces in many homes in other regions of the country, New England is a significant consumer of heating oil. According to the U.S. Energy Information Administration, about 80% of U.S. households that use heating oil are located in the Northeast.
Those of us managing households in the Northeast know that heating oil companies typically offer customers different ways to buy oil. The most basic approach is to buy oil on the spot market. Under this approach, when a customer wants a delivery of oil, the customer can call around and select a supplier for a single delivery. This approach lets customers benefit when prices go down, but leaves customers exposed to the market risk that prices may go up.
One alternative some customers prefer is locking in heating oil prices through a supply contract with a single supplier. According to the EIA, customers' taste for this alternative changes based on predictions about future fuel prices. In the middle of the last decade, about one-third of Northeast homeowners chose contracts; that number approached half of homeowners in 2008 in response to anticipated high fuel prices. As it turned out, petroleum prices fell sharply in the second half of 2008; the fraction of homeowners with supply contracts fell to about 25% in both 2009 and 2010. Now, the EIA reports that heating oil associations in the Northeast are predicting that even fewer customers will lock prices in this year.
Those of us managing households in the Northeast know that heating oil companies typically offer customers different ways to buy oil. The most basic approach is to buy oil on the spot market. Under this approach, when a customer wants a delivery of oil, the customer can call around and select a supplier for a single delivery. This approach lets customers benefit when prices go down, but leaves customers exposed to the market risk that prices may go up.
One alternative some customers prefer is locking in heating oil prices through a supply contract with a single supplier. According to the EIA, customers' taste for this alternative changes based on predictions about future fuel prices. In the middle of the last decade, about one-third of Northeast homeowners chose contracts; that number approached half of homeowners in 2008 in response to anticipated high fuel prices. As it turned out, petroleum prices fell sharply in the second half of 2008; the fraction of homeowners with supply contracts fell to about 25% in both 2009 and 2010. Now, the EIA reports that heating oil associations in the Northeast are predicting that even fewer customers will lock prices in this year.
Subscribe to:
Posts (Atom)
