The U.S. portfolio of electric power plants will continue to shift in 2015, according to a federal assessment projecting that nearly 16 gigawatts (GW) of generating capacity will retire in 2015. Most of the capacity to be retired this year is coal-fired generation. This continues a multi-year trend away from coal, and toward natural gas and renewable resources.
According to the U.S. Energy Information Administration, nearly 16 GW of generating capacity is expected to retire in 2015. Of this, 81% (12.9 GW) is coal-fired generation. Generator retirements are heavily composed of coal-fired generation, split between bituminous coal (10.2 GW) and subbituminous coal (2.8 GW). Most of this retiring
coal capacity is found in the Appalachian region, with slightly more than 8
GW combined in Ohio, West Virginia, Kentucky, Virginia, and Indiana.
New environmental regulations and struggles to remain cost-competitive explain most of these retirements. This year, the Environmental Protection Agency's Mercury and Air Toxics Standards (MATS) take effect. MATS
requires existing large coal- and oil-fired electric generators to meet stricter
emissions standards by retrofitting the units with new emissions control technologies. While some units
have been granted extensions to operate through April 2016, some power plant operators are choosing to retire units instead of making cost-prohibitive investments in pollution control.
Most of the coal-fired units slated for retirement are smaller and operate at
a lower capacity factor than average coal-fired units in the United
States. According to EIA, the to-be-retired units have an average summer nameplate capacity of 158 MW, just 60% as big as the 261 MW average for
other coal-fired units. In 2014, the average capacity factor
for all coal units was 61%, but the subset of coal units retiring in
2015 had an average capacity factor of just 36%. The relatively small size and low capacity factor of these power plants make it harder for them to compete economically against other generation sources. This competition is especially difficult if sufficient natural gas-fired generating capacity is available, as the cost of natural gas has fallen to levels not seen since 2012.
The coal capacity
retiring in 2015 accounted for 1.6% of total U.S. generation during
2014. At the same time, electric generating companies expect to add more than 20 GW of utility-scale generating capacity to the power grid. This new capacity is dominated by wind (9.8 GW), natural gas (6.3 GW), and solar (2.2
GW), which together compose 91% of expected new capacity in 2015.

Energy powers society; society's choices shape energy policy. A blog about our energy resources and the choices they present for society.
Showing posts with label generation mix. Show all posts
Showing posts with label generation mix. Show all posts

FERC 2014 State of the Markets report
Monday, March 23, 2015
U.S. energy markets overseen by the Federal Energy Regulatory Commission in 2014 were impacted by extreme weather and changes in the mix of electric generation resources, according to a report by Commission staff.
The 2014 State of the Markets report issued on March 19 by FERC's Office of Enforcement’s Division of Energy Market Oversight presents Commission's staff’s assessment of recent developments in natural gas, electric, and other energy markets.
Extreme cold temperatures in the first quarter of 2014 affected natural gas infrastructure and power markets across the country. The price of natural gas in the U.S. reached record high levels, driving corresponding spikes in the price of electricity. For example, the price of natural gas at the Transco Zone 6 Non-NY pricing point hit $123/MMBtu in January -- about 33 times higher than the average 2013 U.S. price. Largely due to these price spikes, the spot natural gas price at the Henry Hub pricing point averaged $4.32/MMBtu in 2014, a 16% increase over 2013.
Meanwhile, natural gas and renewable resources continued to displace coal as a fuel for electric power generation. Total U.S. generating capacity increased 10.8 GW in 2014, with natural gas and renewable projects representing the bulk of new capacity. At the same time, utilities retired coal-fired power plants, continuing a trend that started in 2012. Commission staff projects continued coal retirements in 2015, particularly after the April effective date of additional air emissions regulations imposed by the Environmental Protection Agency's Mercury and Air Toxics Standards.
FERC's 2014 State of the Markets report also provides a quick look at 2015 year-to-date market performance. Wholesale electricity prices rose again this winter, although not as sharply as in the first quarter of 2014. FERC staff's report suggests factors helping to moderate winter prices included better cold-weather preparation of assets, programs like ISO New England's Winter Reliability Program, better coordination between operators of electric transmission and natural gas pipelines, record high levels of natural gas production, the development of new pipeline infrastructure, and low oil prices.
August 8, 2011 - what's in your electricity supply mix?
Monday, August 8, 2011
What kinds of generation resources make up your electricity supply mix? While the answers differ across suppliers and over time, the question of what's in your generation basket can affect not only the price you pay for power but also the environmental attributes of the power used to satisfy your demand.
Customers have an interest in understanding which generation resources are in their energy mix. In states like Maine, electricity suppliers and utilities have been required to provide customers mailings containing information on the resource mix. By looking at this data over time (like this August 2010 mailing, this November 2010 mailing, and this July 2011 mailing), customers can understand not only what they've been buying but how it is changing over time.
Now, in a notice of proposed rulemaking (26 page PDF), the Maine Public Utilities Commission proposes to repeal its rule requiring competitive electricity providers and transmission and distribution utilities to provide quarterly mailings with supply mix information. This follows on the heels of a 2011 law change by the Maine State Legislature which opened up more flexibility in how these suppliers must make supply mix information available.
The Maine PUC is entertaining comments on its proposal until September 9, 2011. Will the new rule require (or allow) suppliers to make supply mix information available in electronic or online formats in lieu of paper mailings?
Customers have an interest in understanding which generation resources are in their energy mix. In states like Maine, electricity suppliers and utilities have been required to provide customers mailings containing information on the resource mix. By looking at this data over time (like this August 2010 mailing, this November 2010 mailing, and this July 2011 mailing), customers can understand not only what they've been buying but how it is changing over time.
Now, in a notice of proposed rulemaking (26 page PDF), the Maine Public Utilities Commission proposes to repeal its rule requiring competitive electricity providers and transmission and distribution utilities to provide quarterly mailings with supply mix information. This follows on the heels of a 2011 law change by the Maine State Legislature which opened up more flexibility in how these suppliers must make supply mix information available.
The Maine PUC is entertaining comments on its proposal until September 9, 2011. Will the new rule require (or allow) suppliers to make supply mix information available in electronic or online formats in lieu of paper mailings?
July 21, 2011 - how the electricity supply mix affects air emissions
Thursday, July 21, 2011
The types of generators making up your electricity supply mix vary from region to region and time to time. How that mix is composed affects the air emissions associated with the electric power sector.
Yesterday, I looked at a mailing I recently received about the resources making up my electricity supply. Also included in that fact sheet was this chart showing the average air emissions of carbon dioxide (CO2), nitrogen oxide (NOx), and sulfur dioxide (SO2) in pounds of emissions per megawatt-hour of power sold to customers:

The power sold through this standard offer period averaged 605.86 pounds of CO2 per MWh generated -- 34.5% less than the New England system average over the same time. NOx and SO2 emissions were 0.52 and 0.94 lbs per MWh respectively -- each about half the emissions rate per MWh of the regional average.
Yesterday, I looked at a mailing I recently received about the resources making up my electricity supply. Also included in that fact sheet was this chart showing the average air emissions of carbon dioxide (CO2), nitrogen oxide (NOx), and sulfur dioxide (SO2) in pounds of emissions per megawatt-hour of power sold to customers:

The power sold through this standard offer period averaged 605.86 pounds of CO2 per MWh generated -- 34.5% less than the New England system average over the same time. NOx and SO2 emissions were 0.52 and 0.94 lbs per MWh respectively -- each about half the emissions rate per MWh of the regional average.
March 31, 2011 - Canada backs Lower Churchill hydro project
Thursday, March 31, 2011
The Canadian federal government has just announced that it will support the Lower Churchill hydroelectric project in Labrador. The $6.2 billion project has been in the planning phases for years, but now appears to be moving forward.
Rich in natural resources, Canada is home to a great number of rivers with significant hydropower potential. Many of these rivers have been dammed and developed in the past century; second only to China, Canada is now a leading producer of hydropower in the world. In recent years, Canada has been one of the few countries to produce a majority of its electricity from hydropower, with some provinces like Quebec, Manitoba, and Labrador producing over 90% of their electricity from hydro dams.
Since 1971, much of the Churchill River's flow has been diverted into the Churchill Falls hydroelectric station. At 5,428 MW, the existing Churchill Falls project has the second largest capacity of any power station in North America. The Lower Churchill project entails building two new plants (Gull Island and Muskrat Falls) with a combined capacity of over 3,074 MW.
It remains to be seen what form the support of the Canadian federal government will take.
Rich in natural resources, Canada is home to a great number of rivers with significant hydropower potential. Many of these rivers have been dammed and developed in the past century; second only to China, Canada is now a leading producer of hydropower in the world. In recent years, Canada has been one of the few countries to produce a majority of its electricity from hydropower, with some provinces like Quebec, Manitoba, and Labrador producing over 90% of their electricity from hydro dams.
Since 1971, much of the Churchill River's flow has been diverted into the Churchill Falls hydroelectric station. At 5,428 MW, the existing Churchill Falls project has the second largest capacity of any power station in North America. The Lower Churchill project entails building two new plants (Gull Island and Muskrat Falls) with a combined capacity of over 3,074 MW.
It remains to be seen what form the support of the Canadian federal government will take.
March 15, 2011 - US nuclear industry
Tuesday, March 15, 2011
As Japan assesses the damage from last Friday's magnitude 8.9 earthquake and tsunami, one element of the disaster that remains ongoing involves damage to several of that nation's nuclear power plants. Utility Tokyo Electric Power has imposed blackouts due to a 25 percent capacity shortage, which may be the least of the concerns stemming from the damaged nuclear plants. Concerns over meltdown and release of radioactive materials loom larger.
In the immediate wake of the situation in Japan, it may be helpful to consider a snapshot of the U.S. nuclear power industry. According to the U.S. Energy Information Administration (1 page PDF), in 2009 the U.S. nuclear industry was composed of 104 generators with an aggregate nameplate capacity of 106,618 megawatts. This represents about 9.5% of the nation's 1,121,686 MW total installed nameplate capacity. Electricity derived from nuclear power thus ranks third in nameplate capacity behind natural gas (459,803 MW) and coal (338,723 MW).
Nuclear power plays an even bigger role in the U.S. electric industry on a megawatt-hour basis. Remember that megawatts of capacity refer to how much energy could be produced at a given moment if all the units ran full-bore, while megawatt-hours of energy refer to how much energy was actually produced. In 2010, nuclear power produced 981,815 thousand MWh out of a total 4,120,028 thousand MWh produced -- or about 24% of the nation's total electric generation. This is due in part to the high capacity factor of nuclear power, meaning that nuclear plants tend to run near their full capacity and have minimal downtime.
Let's keep Japan in our thoughts and hope the people and the nation recover well and quickly.
 |
| A recent snapshot of the price of gas in Maine: $3.539 per gallon for 87 octane regular. |
In the immediate wake of the situation in Japan, it may be helpful to consider a snapshot of the U.S. nuclear power industry. According to the U.S. Energy Information Administration (1 page PDF), in 2009 the U.S. nuclear industry was composed of 104 generators with an aggregate nameplate capacity of 106,618 megawatts. This represents about 9.5% of the nation's 1,121,686 MW total installed nameplate capacity. Electricity derived from nuclear power thus ranks third in nameplate capacity behind natural gas (459,803 MW) and coal (338,723 MW).
Nuclear power plays an even bigger role in the U.S. electric industry on a megawatt-hour basis. Remember that megawatts of capacity refer to how much energy could be produced at a given moment if all the units ran full-bore, while megawatt-hours of energy refer to how much energy was actually produced. In 2010, nuclear power produced 981,815 thousand MWh out of a total 4,120,028 thousand MWh produced -- or about 24% of the nation's total electric generation. This is due in part to the high capacity factor of nuclear power, meaning that nuclear plants tend to run near their full capacity and have minimal downtime.
Let's keep Japan in our thoughts and hope the people and the nation recover well and quickly.
November 30, 2010 - coal-burning Salem Harbor Power Station to close?
Tuesday, November 30, 2010
To generate electricity, humans rely on a variety of different technologies, ranging from burning coal to make steam, to combined-cycle natural gas turbines, to renewable resources like hydroelectricity and solar photovoltaics. Over time, the portfolio of energy resources upon which we rely may shift to less environmentally harmful assets.
For an example of how certain generation technologies may fall out of the generation mix, take the planned closing of the Salem Harbor Power Station. Located in Salem, Massachusetts (a city that sports solar photovoltaic-powered trash compactors on its sidewalks), this plant is one of several coal-fired power plants closing scheduled for the coming years. Since it started operations in 1951, the Salem Harbor Power Station has expanded and now generates 745 megawatts by burning coal and oil. Although the plant, currently owned by Dominion Resources, Inc. has increased its pollution control systems over the years, it was listed as one of the state’s “filthy five” dirtiest power plants in 2000, a hard reputation to shake. A study by Harvard University researchers at about the same time blamed the plant for 30 premature deaths annually, primarily due to air emissions.
Dominion, which purchased the plant in 2005, took steps to reduce emissions such as switching to lower the sulfur content of the coal burned there. However, the Salem plant has reportedly received $12 million in investments from Dominion since 2005—a marked contrast with the more than $1 billion Dominion invested into its 1,547 megawatt coal plant at Brayton Point in Somerset, Massachusetts.
As it is often the case, declining investments may result in the demise of production operations. Also, I have seen in similar context, the declining investments arise in part from declining economics that are to be seen at that facility. In the case of the Salem Harbor Power Station, the fact that Dominion could not shift the costs of new pollution controls to rate payers made further investment in the plant uneconomic. As a merchant generator in the ISO New England system, Dominion takes a market clearing price for its power, and thus cannot raise its rates over other resources to cover future increases in pollution control expenses.
The Salem Harbor Power Station is also a good example of how an increase in environmental regulation may lead to higher costs for certain kinds of generation units (in this case, coal-fired generation stations). Regulatory requirements to improve pollution control result in higher operational costs; these higher costs may in turn make even a relatively low fuel cost unit (such as coal) comparatively uneconomic. By comparison, once pollution controls are imposed on coal-burning units, the fact that renewable units such as wind or hydro or natural gas-fired units may not require such expensive pollution controls makes them relatively more economic.
Over time, it seems the balance has shifted, the generation mix will shift piece by piece as less economic units such as the Salem plant close, and new more economic units come online. Note that this does not always mean that the price of power goes down; rather, in this case, it is not that wind and hydro got cheaper, nor natural gas, but rather that the cost of coal now includes more expensive pollution control requirements, making it less economic. In 2009, coal fueled 12.8% of the New England portfolio; we shall soon see what 2010 has brought.
One other note on what happens if the Salem Harbor Station goes dark: ISO New England is now studying how to replace the plant, and true to its mission, is considering increasing transmission system upgrades in the region. This is an interesting example of how ISO New England focuses on transmission solutions — perfectly natural given its mandate — to replace a generation asset. While not all generation assets can be effectively replaced by transmission solutions, transmission between a remote generation resource and load may serve to replace at least some generation assets. Whether this will be correct in Salem remains to be seen. Within five years, the Salem station may be closed.
For an example of how certain generation technologies may fall out of the generation mix, take the planned closing of the Salem Harbor Power Station. Located in Salem, Massachusetts (a city that sports solar photovoltaic-powered trash compactors on its sidewalks), this plant is one of several coal-fired power plants closing scheduled for the coming years. Since it started operations in 1951, the Salem Harbor Power Station has expanded and now generates 745 megawatts by burning coal and oil. Although the plant, currently owned by Dominion Resources, Inc. has increased its pollution control systems over the years, it was listed as one of the state’s “filthy five” dirtiest power plants in 2000, a hard reputation to shake. A study by Harvard University researchers at about the same time blamed the plant for 30 premature deaths annually, primarily due to air emissions.
Dominion, which purchased the plant in 2005, took steps to reduce emissions such as switching to lower the sulfur content of the coal burned there. However, the Salem plant has reportedly received $12 million in investments from Dominion since 2005—a marked contrast with the more than $1 billion Dominion invested into its 1,547 megawatt coal plant at Brayton Point in Somerset, Massachusetts.
As it is often the case, declining investments may result in the demise of production operations. Also, I have seen in similar context, the declining investments arise in part from declining economics that are to be seen at that facility. In the case of the Salem Harbor Power Station, the fact that Dominion could not shift the costs of new pollution controls to rate payers made further investment in the plant uneconomic. As a merchant generator in the ISO New England system, Dominion takes a market clearing price for its power, and thus cannot raise its rates over other resources to cover future increases in pollution control expenses.
The Salem Harbor Power Station is also a good example of how an increase in environmental regulation may lead to higher costs for certain kinds of generation units (in this case, coal-fired generation stations). Regulatory requirements to improve pollution control result in higher operational costs; these higher costs may in turn make even a relatively low fuel cost unit (such as coal) comparatively uneconomic. By comparison, once pollution controls are imposed on coal-burning units, the fact that renewable units such as wind or hydro or natural gas-fired units may not require such expensive pollution controls makes them relatively more economic.
Over time, it seems the balance has shifted, the generation mix will shift piece by piece as less economic units such as the Salem plant close, and new more economic units come online. Note that this does not always mean that the price of power goes down; rather, in this case, it is not that wind and hydro got cheaper, nor natural gas, but rather that the cost of coal now includes more expensive pollution control requirements, making it less economic. In 2009, coal fueled 12.8% of the New England portfolio; we shall soon see what 2010 has brought.
One other note on what happens if the Salem Harbor Station goes dark: ISO New England is now studying how to replace the plant, and true to its mission, is considering increasing transmission system upgrades in the region. This is an interesting example of how ISO New England focuses on transmission solutions — perfectly natural given its mandate — to replace a generation asset. While not all generation assets can be effectively replaced by transmission solutions, transmission between a remote generation resource and load may serve to replace at least some generation assets. Whether this will be correct in Salem remains to be seen. Within five years, the Salem station may be closed.
November 4, 2010 - what kinds of generation make up Maine's standard offer mix?
Thursday, November 4, 2010
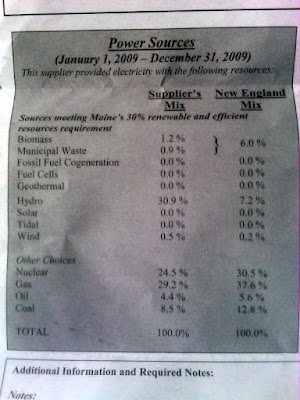
The photo above shows a recent mailing I received at my house detailing the power source mix for the current standard offer provider for customers of Central Maine Power's T&D network: NextEra Energy Power Marketing, LLC.
You can see that the largest share of power sourced by NextEra in 2009 was hydro (30.9%), with gas a close second (29.2%) and nuclear power (basically, Seabrook) at 24.5%. In total, 33.5% of NextEra's energy supply came from sources meeting Maine's renewable portfolio standard requirements. By contrast, the average New England mix is more heavily weighted in gas, nuclear, and coal, with renewable sources playing a much smaller role.
The generation mix is not simply an academic question; it has implications for other policy choices. For example, we've seen in past entries how the generation mix can affect other environmental claims, like what kind of emissions are associated with electric vehicles.
Interestingly, the supply mix is slightly different from the last time I got a notice.
September 14, 2010 - net-zero modular homes; questions about electric vehicles
Tuesday, September 14, 2010
 |
| A waterfall deep in the Maine woods. This energy of this river was formerly used for log drives. |
- I've been following the bidding war to buy Ram Island Ledge Lighthouse on the edge of Casco Bay in Maine. Just as the bidding was set to close yesterday, a new bid came in for $185,000 -- giving other bidders another 24 hours to raise the stakes. We'll see what happens!
- Renewable home energy: Kaplan Thompson Architects and Keiser Industries LLC of Oxford, Maine have teamed up to design and manufacture modular net-zero homes: i.e. residences that are designed not only to minimize energy consumption, but also to be able to generate at least as much energy as they consume. Starting costs are around $205,000. The first models will be installed in an affordable housing development on Peaks Island in Portland -- but without the solar hot water and electric systems that will truly make later homes net zero.
- This Portland Press Herald article by Tom Walsh notes that plug-in electric vehicles rely on grid-purchased electricity to run, meaning that their fuel costs and that fuels' emissions characteristics will be determined by the policies affecting the overall electricity generation mix. Interestingly, he links former Maine Governor Angus King's current interest in land-based wind generation to Governor King's support for electricity market deregulation -- and the ISO-NE policies that mean that all resources get paid the marginal price of the last unit needed to clear to support load.
Subscribe to:
Posts (Atom)
