Showing posts with label portfolio. Show all posts

ISO-NE 2022 generation portfolio emissions report

Tuesday, January 16, 2024

New England's electric power generation fleet emitting slightly less carbon dioxide in 2022 relative to 2021, according to the grid operator's 2022 ISO New England Electric Generator Air Emissions Report.

ISO New England operates the regional transmission grid and the wholesale market for electricity. In support of this role, ISO-NE tracks the portfolio of generation resources used in the region, as well as the resources' emission characteristics.

According to ISO-NE, New England generation emitted 33,382 kilotons of carbon dioxide in 2022, a decline of two-tenths of a percent relative to 2021. The grid operator reports an average 2022 emission rate of 643 pounds of CO2 per megawatt-hour of New England generation. 

Over longer time scales, air emissions from New England's power plants have decreased significantly. "From 2001 through 2022, CO2 emissions fell by 37%, NOx emissions fell by 79%, and SO2 emissions fell by 98%."

While carbon dioxide emissions decreased slightly again this year, sulfur dioxide (SO2) emissions increased to 3.38 kilotons, climbing over 60 percent relative to 2021. The grid operator attributes the sulfur emissions to increased reliance on fuel oil for electric generation:

More electricity came from oil-fired generators in 2022 than in the previous four years combined. At 1,845 GWh, production from these resources in 2022 was eight times higher than in 2021. Oil has a high sulfur content, so SO2 emissions rise when these resources produce more power.

The chart below shows the region's generation portfolio on a monthly basis for 2022; the red and black bars at the top of each month's column represent oil and coal use. The largest blue bars represent natural gas, while the largest orange bars represent nuclear power.

ISO-NE attributes increased use of oil for power generation to "record high natural gas prices associated with the Russia-Ukraine conflict, and thus an increase in regional reliance on oil versus natural gas." The grid operator also says that decreases in coal generation largely offset the increased oil use for purposes of CO2 and NOX emissions.


New England 2019 Regional Energy Outlook describes shifts, challenges

Thursday, March 21, 2019

New England's electricity system is shifting toward a "hybrid grid," according to the operator of New England's wholesale electricity markets and electric transmission system. A recent report by ISO New England, Inc. describes the electric sector's transition towards generating resources with lower carbon emissions and the resulting implications for the environment and the economy.

ISO New England is the federally-designated regional transmission organization serving New England. The grid operator recently released its 2019 Regional Energy Outlook, a document described as “one of the many ways the ISO keeps stakeholders informed about the current state of the grid, issues affecting its future, and ISO initiatives to ensure a modern, reliable power system for New England.”

In the report, ISO New England emphasizes the region’s decarbonization and shifting resource mix, noting that “carbon emissions from the grid have fallen by roughly a third... the region is on its way from having an electric grid dominated by fossil-fuel and nuclear generation to one that includes large amounts of wind and hydro generation and hundreds of thousands of small solar and storage systems spanning the six states. The states’ next step in their decarbonization journey is to transition the emissions-heavy heating and transportation sectors to low-carbon electricity.”

ISO-NE describes the way these changes are happening as “challenging reliable system operations and competitive wholesale electricity markets.” ISO says that “for the foreseeable future, the region will remain vulnerable to energy shortfalls and wholesale price volatility as more and more resources with limited-energy ‘inventories’ (natural gas generation, wind, solar, battery storage) displace resources with on-site fuel that can sustain operation for extended periods (oil, coal, nuclear, dual-fuel generation).”

ISO New England says its competitive markets weren’t designed to telegraph future energy scarcity conditions, compensate resources for fuel inventory, achieve carbon reduction goals, or specifically lead to renewable development. It notes that state-sponsored resources suppress market prices when in markets, but would lead to overbuild if outside markets. ISO advocates, “Establishing a realistic price on carbon remains a more seamless and simpler way to achieve clean-energy goals through markets without distorting competition, but this is not in the ISO’s jurisdiction. State or federal policymakers could pursue this direction but have not done so to date.” ISO notes, “Nuclear resources will prove critical to meeting both decarbonization and energy-security goals for years to come, but how they can remain financially viable is still unclear.”

ISO-NE says it is focused on 3 elements to support the transition to the “hybrid grid”: supporting the rapid transformation of the region’s electricity supply and demand mix, maintaining a robust transmission system, and ensuring energy security. 

The grid operator also noted limitations on what tools it can use to address these challenges: “Importantly, ISO New England does not have the authority to dictate investments in energy infrastructure that can help ensure that the region’s energy needs can be met in all seasons, under all conditions. Our toolkit is to create financial stimuli through the wholesale electricity markets that will drive action. Opposition or impediments to infrastructure decisions will only exacerbate the region’s energy-security constraints.”

New Mexico legislature passes 100 percent renewable power law

Thursday, March 14, 2019

The New Mexico state legislature has passed a bill that requires public utilities other than rural electric cooperatives and municipalities to supply all retail sales of electricity in New Mexico with zero carbon resources by 2045.

The bill is SB 489, also known as the Energy Transition Act. Much of the Energy Transition Act focuses on procedures allowing utilities to obtain approval to abandon generating facilities which obtaining financing orders from the New Mexico Public Regulation Commission allowing the utilities to recover all of their energy transition costs through securitization -- issuing energy transition bonds whose costs the utilities pay by collecting an "energy transition charge" from their customers. The act creates funds to provide training and economic development in communities within 100 miles of abandoned facilities.

The law also revises New Mexico's renewable portfolio standard. It requires distribution cooperatives to sell at least 40 percent renewable energy by 2025 and at least 50 percent renewable energy by 2030, and sets a "zero carbon resource standard" target for distribution cooperatives by 2050, composed of at least 80 percent renewable energy, if feasible from technical, reliability, and affordability perspectives. For public utilities other than rural electric cooperatives and municipalities, the law requires similarly increasing percentages of renewable power, including 80 percent renewable energy resources by 2040 and 100 percent zero carbon resources by 2045. It allows public utilities to ask the Commission to provide financial or other incentives in excess of these amounts.

The bill passed the state senate with a vote of 32-9, and the state house with a vote of 43-22. It now goes to Governor Michelle Lujan Grisham for her signature. According to a statement Governor Lujan Grisham issued on March 12, "The Energy Transition Act is a promise to future generations of New Mexicans."

Other states are considering changes to their renewable portfolio standards, carbon emission limits, and other legal requirements affecting the electric power sector. If SB 489 is enacted into law, New Mexico will join California and Hawaii in having a future commitment or goal of 100 percent carbon-free electricity.

Feds predict US coal consumption falling to 1979 levels

Tuesday, December 4, 2018

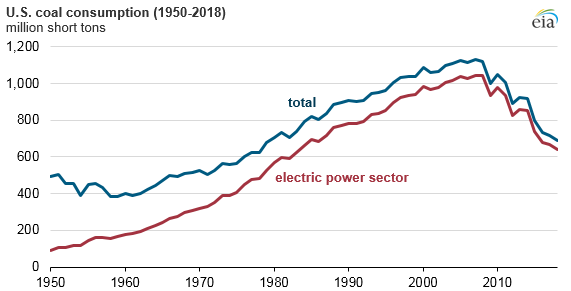
U.S. coal consumption in 2018 will reach its lowest level since 1979, according to a prediction by the U.S. Energy Information Administration. Reduced coal use for electricity generation is the largest contributor to the decline, driven by factors including economics and environmental regulations.

The EIA tracks total U.S. coal consumption. According to its latest forecast, EIA expects total U.S. coal consumption in 2018 to fall to 691 million short tons. This represents a 4% decline from 2017, and would bring coal use in line with 1979 levels.

Source: U.S. Energy Information Administration

EIA cites reductions in the use of coal to generate electricity as the largest contributor to this decline. Between 2007 and 2018, 93% of total U.S. coal consumption was for electricity generation. But shifts in how the country generates power -- including retirements of over 66 gigawatts of coal-fired power plants since 2007, plus decreases in the utilization or capacity factor of most remaining coal-fired generators -- have reduced the nation's consumption of coal.

Part of the shift away from coal-fired power production can be explained by economics. Natural gas prices have generally remained relatively low compared to coal prices over the past decade, and fuel-free renewable power projects are on the rise.

Environmental regulations such as the Mercury and Air Toxics Standards (which took effect in 2015) have also contributed to the shift, both directly (for example, restricting carbon emissions) and indirectly (by affecting the economics of coal-fired power generation and prompting further plant retirements instead of investments in environmental controls).

EIA predicts that the trend away from coal will continue in the short term, projecting power sector coal consumption to fall by a further 8% in 2019.

FERC Order 842 requires primary frequency response by generators

Monday, March 12, 2018

U.S. energy regulators have issued an order amending standard interconnection agreements to require new generators to install, maintain and operate a functioning governor or equivalent controls capable of primary frequency response as a precondition of interconnection. The Federal Energy Regulatory Commission's Order No. 842 also amended the pro forma interconnection agreements to include certain operating requirements including maximum droop and deadband parameters, and sustained response provisions.

As described by the Commission, reliable operation of an alternating current grid requires maintaining system frequency within predetermined boundaries above and below 60 Hertz. Frequency response describes an interconnected grid’s ability to arrest and stabilize deviations from this predetermined range of frequencies after a sudden loss of generation or load.

Historically, the U.S. grid's primary frequency response capability came from baseload synchronous generators such as coal-fired power plants. But many such plants have retired in recent years, with further retirements expected. In 2016, the Commission noted that shifts in the portfolio of U.S. electric generators meant fewer resources could likely provide primary frequency response, especially if new variable energy resources such as wind and solar did not provide this service. In response, it opened an inquiry into what primary frequency response reforms it should make.

On February 15, 2018, the Commission issued its Order No. 842 revising its regulations to require newly interconnecting large and small generating facilities, both synchronous and non-synchronous, to install, maintain, and operate equipment capable of providing primary frequency response as a condition of interconnection. The final rule also amends the Commission's pro forma interconnection agreements to include certain operating requirements including maximum droop and deadband parameters, and sustained response provisions. It provides exemptions for nuclear power plants and some combined heat-and-power plants.

These requirements will apply to most newly interconnecting generation facilities that execute, or request the unexecuted filing of, an LGIA or SGIA on or after the rule’s effective date, as well as to existing large and small generating facilities that take any action that requires the submission of a new interconnection request that results in the filing of an executed or unexecuted interconnection agreement on or after the effective date.

In a press release, the Commission said its action was intended to address "the increasing impact of the evolving generation resource mix." Commissioner LaFleur made a separate statement in which she noted that while decreases in the nation's portfolio percentage of synchronous generation have contributed to declining frequency response performance, "recent technological advancements have enabled new non-synchronous generating facilities, such as wind and solar, to cost-effectively include primary frequency response capabilities in their facilities." Improved inverters and battery storage are among these innovations.

The Commission has also recently noted the potential of electric storage resources to provide frequency response and other services. Its Order No. 841 is designed to remove barriers to the participation of electric storage resources in wholesale markets operated by regional transmission organization and independent system operators, including markets for frequency response.

FERC distributed energy resource technical report

Wednesday, February 21, 2018

A technical report by U.S. electricity regulatory staff assesses the potential reliability issues and likely benefits to the bulk power system resulting from an increased penetration of distributed energy resources. According to the report, increasing penetration of distributed energy resources may bring several associated reliability benefits to the bulk power system -- or could cause reliability concerns, if the resources are not properly accounted for.

Distributed energy resources, or DERs, have no single definition -- but they are generally conceived of as small, geographically dispersed electric resources, installed and operated on the distribution system at voltage levels below the typical bulk power system levels of 100kV. Historically, the term focused on generation like rooftop solar panels or on-site combined heat and power plants, but its meaning has broadened to include energy efficiency, microgrids, and even new technologies like energy storage. Distributed energy resources can be cost-effective alternatives to traditional utility infrastructure and business models.

Distributed energy resources installations have increased significantly in some regions of the United States in recent years thanks to factors including technology advances and state energy policies. In 2016, when distributed energy resources of all types accounted for about two percent of the nation's installed generation capacity, distributed solar photovoltaic (PV) installations alone represented over 12 percent of new capacity additions.  At the same time, regulators and industry participants are working to integrate these resources into the grid from engineering, reliability, and system planning perspectives.

In February 2018, staff of the Federal Energy Regulatory Commission published a report, "Distributed Energy Resources: Technical Considerations for the Bulk Power System." This report filed in Docket No. AD18-10-000 considers how the increasing penetration and integration of distributed energy resources in specific regions may affect bulk power system reliability. It summarizes technical assessments performed by Commission staff using industry power system models and commercially available power system simulation software "to identify the potential reliability issues and likely benefits to the bulk power system" from increasing distributed energy resource penetration. The study notes that its modeling of distributed energy resource capacity was "based on current trends for technology types, operational capabilities, and deployment distributions."

According to the report, greater penetration of distributed energy resources could have associated reliability benefits for the bulk power system. For example, by providing power close to the customer distributed resources can serve to reduce grid losses and reduce system peak load, or can serve as non-transmission alternatives that displace the need for more expensive wires upgrades.

At the same time, the report warns that "increasing DER capacity, if not properly accounted for, could cause reliability concerns for the bulk power system." It calls for improving and refining the data that is available for distributed energy resources for incorporation into planning and operating models, noting, "Collecting and using the most current and accurate data is key to getting a complete picture of how DERs affect the bulk power system."

The report identified key bulk power system reliability topics to explore in light of the growing adoption of distributed energy resources in the U.S., including:
  • The impact of the current common industry modeling practice of netting DERs with load, which may mask the effects of DER operation;
  • DER capabilities for voltage and frequency ride through during contingencies;
  • The potential for improved voltages due to the unloading of the bulk power system associated with the location of DERs at or near customer loads;
  • Potential effects upon system -wide transmission line flows and generation dispatch due to changing load patterns;
  • The sensitivity of voltage or power needs to different types of DER applications (i.e., providing energy, capacity, or ancillary services);
  • The need to develop planning processes that capture more detailed models of DERs and allow for modeling of the interface between the transmission and distribution systems to enable information exchange and more accurate calculations of the DER impact on the bulk power system; and
  • The advantages and disadvantages of allowing DERs to participate directly in the organized wholesale electric markets.
The report also calls for continued examination of other issues, such as "sensitivities with higher DER penetration levels, changes in siting patterns, and potential impacts to the system’s response to events, disruptions and outages, including frequency events." It concludes, "Efforts such as these could help track and assess the impact of changing conditions on the bulk power system to identify emerging trends and address potential future reliability challenges."

New England's electric grid and winter 2017-18

Monday, December 11, 2017

New England's electricity grid is ready for reliable operations this winter, says the region's grid operator -- but special operating procedures might be required in the case of unexpected outages or fuel delivery constraints.

According to ISO New England Inc., the independent, not-for-profit regional transmission organization responsible for almost all of New England, supplies of electricity should be sufficient to meet regional consumer demand this winter. The grid operator projects a peak demand of 21,197 megawatts under normal winter temperatures (about 7 degrees Fahrenheit), or 21,895 megawatts of peak demand if extreme weather occurs (2 degrees F).

These projections are higher than last winter's actual peak demand (19,647 MW on December 15, 2016, during the hour from 5 to 6 p.m.), but lower than the region's all-time winter peak (22,818 MW, on January 15, 2004) or the record peak (28,180 MW on August 2, 2006). ISO-NE notes that total energy consumption and regional peak demand have remained flat in recent years "as a result of increased use of energy-efficiency measures and behind-the-meter solar photovoltaic (PV) systems."

The grid operator projects that it has commitments from enough power plants and demand-side resources to meet the forecast peak demand under both normal and extreme weather conditions. ISO-NE also points to its fifth seasonal Winter Reliability Program provides incentives for generators to stock up on oil or contract for liquefied natural gas, and also for demand-side resources committing to be available. As noted by the grid operator, the availability of generators with fuel has been a key reliability factor during recent cold winters, thanks in part to the past winter reliability programs. ISO-NE says its new capacity market performance incentive rules which take effect June 1, 2018 should eliminate the need for future special programs.

At the same time, the grid operator warns of its "continuing concern" over the availability of fuel for those power plants to generate electricity when needed. In a press release, ISO-NE noted, "The region’s natural gas delivery infrastructure has expanded only incrementally, while reliance on natural gas as the predominant fuel for both power generation and heating continues to grow." It observed that over 4,000 megawatts of natural-gas-fired generating capacity is at risk of not being able to get fuel when needed, due to natural gas pipeline constraints.

The grid operator also cites changes to the regional portfolio of generating resources, such as the May 2017 retirement of a 1,500 MW coal- and oil-fired power plant. According to ISO-NE, the Brayton Point power plant's closure "removed a facility with stored fuel that helped meet demand when natural gas plants were unavailable." The reliability benefits of stockpiled fuel and baseload power and related proposals are currently under examination by the Federal Energy Regulatory Commission.

The grid operator listed challenges that could affect power system operations such as "if demand is higher than projected, if the region loses a large generator, electricity imports are affected, or when natural gas pipeline constraints limit the fuel available to natural-gas-fired power plants," as well as the special operating procedures it would invoke in those circumstances.

DOE Hydropower Vision report

Tuesday, August 9, 2016

The U.S. Department of Energy (DOE) has released a report on the future of domestic hydropower.  Its Hydropower Vision finds that U.S. hydropower could grow from 101 gigawatts of capacity in 2015 to nearly 150 gigawatts by 2050.  More than 50% of this growth could be realized by 2030, according to the report.  Much of the new capacity would come from pumped storage, with the remainder coming from upgrades to existing plants, adding power at existing dams and canals, and "limited development of new stream-reaches."

DOE's Wind and Water Power Technologies Office describes its report, Hydropower Vision: A New Chapter for America’s First Renewable Electricity Source, as presenting "a first-of-its-kind comprehen sive analysis to evaluate future pathways for low-carbon, renewable hydropower (hydropower generation and pumped storage) in the United States, focused on continued technical evolution, increased energy market value, and environmental sustainability." While it does not evaluate or recommend new policy actions, the report does analyze the "feasbility and certain benefits and costs of various credible scenarios, all of which could inform policy decisions at the federal, state, tribal, and local levels."

The report's Executive Summary presents an overview of the report, and its three "pillars" or foundational principles developed in collaboration with stakeholders: optimizing the value and power generation contribution of the existing hydropower fleet, exploring the feasibility of "credible long-term deployment scenarios for responsible growth of hydropower capacity and energy production," and sustainability.  Analyzing data and modeled scenarios, the report found that "under a credible modeled scenario in which technology advancement lowers capital and operating costs, innovative market mechanisms increase revenue and lower financing costs, and a combination of environmental considerations are taken into account—U.S. hydropower including PSH could grow from 101 GW of capacity in 2015 to 150 GW by 2050."

Chapter 1 of the Hydropower Vision describes how technical resource assessments and computational models can be used to interpret hydropower's future market potential.  It also evaluates potential innovations or nontraditional approaches to technology and project development that could affect the future development of new hydropower projects.

Chapter 2 of the Hydropower Vision presents a snapshot of the state of the U.S. hydropower industry as of year-end 2015, from the Energy Department's perspective.  It notes that hydropower generation and pumped storage have "provided a stable and consistently low-cost energy source throughout decades of fluctuations and fundamental shifts in the electric sector, supporting development of the U.S. power grid and the nation’s industrial growth in the 20th century and into the 21st century." The report points to 2015 data showing 2,198 active hydropower plants in the U.S. with a total capacity of 79.6 gigawatts, plus 42 pumped storage hydro plants totaling another 21.6 gigawatts.  In 2015, hydropower provided about 6.2% of net U.S. electricity generation, and 48% of all U.S. renewable power.

Chapter 3 of the report explores over 50 possible future scenarios for the hydropower industry, to assess the nation's hydropower potential.  It presents an extensive body of analysis, considering potential contributions over time to the electric sector of both the existing hydropower fleet and new hydropower deployment resulting from: upgrades at existing plants, powering of non-powered dams (NPD), pumped storage hydropower (PSH), and new stream-reach development (NSD).  It found that the greatest influence on potential growth scenarios comes from 3 variables: technological innovation, environmental considerations, and financial improvement.

The report's fourth chapter lays out a roadmap of 64 potential actions for stakeholder consideration, "to optimize hydropower’s continued contribution to a clean, reliable, low-carbon, domestic energy generation portfolio while ensuring that the nation’s natural resources are adequately protected or conserved."  These actions are organized around 5 topical areas: technology advancement, sustainable development and operation, enhanced revenue and market structures, regulatory process optimization, and enhanced collaboration, education, and outreach.

As noted by the Energy Department, while utility-scale battery storage projects are starting to be developed, most U.S. electricity storage capacity takes the form of pumped storage.  Flexible and reliable generating or storage resources can support efforts to integrate increasing amounts of intermittent renewable energy sources, like wind and solar, into the grid.

NY Clean Energy Standard adopted

Wednesday, August 3, 2016

The New York Public Service Commission has issued an order adopting a clean energy standard.  The standard will require 50% of New York’s electricity to be generated by renewable sources by 2030.  This so-called "50 by 30" mandate is consistent with the State Energy Plan's strategy to reduce statewide greenhouse gas emissions by 40% by 2030.  It will also provide support for existing nuclear power plants said to be at risk for closure without state support.  This is a time of change for the New York energy industry, as the Clean Energy Standard adds to the regulatory and retail market changes that the state is already pursuing under its Reforming the Energy Vision or REV program.

The New York commission noted that the state has adopted "strongly proactive policies to combat climate change and modernize the electric system to improve the efficiency, affordability, resiliency, and sustainability of the system." The state's 2015 State Energy Plan called for the "50 by 30" goal for renewable energy.

In the Commission's words, it determined "that a series of deliberate and mandatory actions to build upon and enhance opportunities for consumer choice are necessary to achieve State environmental, public health, climate policy and economic goals; to enhance and animate voluntary retail markets for energy efficiency, clean energy and renewable resources; to preserve existing zero-emissions nuclear generation resources as a bridge to the clean energy future; to ensure a modern and resilient energy system; and to accomplish its objectives in a fair and cost-effective manner."

As a result, the Commission adopted a Clean Energy Standard or CES consisting of a Renewable Energy Standard and a Zero-Emissions Credit Requirement program.  The Commission also adopted supporting structures, which it describes as including:
(a) program and market structures to encourage consumer-initiated clean energy purchases or investments; (b) obligations on load serving entities to financially support new renewable generation resources to serve their retail customers; (c) a requirement for regular renewable energy credit (REC) procurement solicitations; (d) obligations on distribution utilities on behalf of all retail customers to continue to financially support the maintenance of certain existing at-risk small hydro, wind and biomass generation attributes; (e) a program to maximize the value potential of new offshore wind resources; and (f) obligations on load serving entities to financially support the preservation of existing at- risk nuclear zero-emissions attributes to serve their retail customers.
As described by Governor Andrew Cuomo, the program will feature a ramp-up of renewable power sourcing.  Utilities and other energy suppliers will be initially required to procure 26.32 percent of the state's total electricity load from renewable sources in 2017, increasing to 30.54 percent by 2021.  The Commission described the 50 by 30 goal as "not only part of a larger greenhouse gas goal, it is part of the State’s sweeping initiative to transform the way energy is produced, delivered, and consumed" through the REV process.

The Clean Energy Standard order also creates a Zero-Emissions Credit or ZEC requirement, along with a process through which state energy agency NYSERDA will offer qualifying nuclear facilities a multi-year contract for the purchase of ZECs, at a price ultimately derived from the calculations of "social cost of carbon."  NYSERDA will ultimately resell the ZECs to New York load serving entities, who will recover costs from ratepayers through commodity charges on customer bills.  The Commission described the ZEC mechanism as "the best way for the State to preserve the nuclear units’ environmental attributes while staying within the State’s jurisdictional boundaries. "

As described in the order, the Renewable Energy Standard and ZEC components "are interrelated but the goals are additive," meaning efforts to comply with the RES will not count toward the ZEC requirement, even if the combination will "contribute toward the State's comprehensive greenhouse gas reduction goals."

US Clean Power Plan adopted

Monday, August 3, 2015

President Obama will formally unveil the Clean Power Plan today, a set of regulations by the U.S. Environmental Protection Agency (EPA) to reduce carbon emissions associated with the electric power industry.  A blog post by EPA Administrator Gina McCarthy emphasizes the Clean Power Plan's protection of health and the environment, states' rights to choose their own implementation paths, reduction of future energy costs, and leadership on climate issues.  But some politicians, utilities and states have expressed concern about the regulations' impact, and could launch legal challenges -- or states might refuse to comply.  What's in store for the Clean Power Plan?

It has been just over a year since EPA first released its draft Clean Power Plan in June 2014.  These regulations under Section 111(d) of the Clean Air Act are designed to reduce the carbon intensity of the U.S. electric power sector -- essentially, how many pounds of carbon are emitted per megawatt-hour of electric energy produced.  Under the draft Clean Power Plan, EPA sets carbon intensity limits for each state, collectively designed to reduce carbon emissions by 30% below 2005 levels.  Each state then designs its own compliance plan using any combination of "building blocks": types of measures like improving the efficiency of fossil fuel power plants, switching out coal- and oil-fired power plants in favor of natural gas, and increasing low- and zero-carbon generation.

While the final Clean Power Plan's basic structure remains much the same, EPA has made some modifications in reaction to concerns about the greenhouse gas regulations' costs and impacts to grid reliability.

Changes from the 2014 draft include:
  • Two extra years (until 2022) for states to meet their targets, and greater flexibility for states to form regional pacts to facilitate emissions-cutting projects across state lines, such as the Regional Greenhouse Gas Initiative.
  • A new “safety valve” feature, to let states appeal for extensions and other relief if complying with the regulations causes disruptions to power supply.
  • Increased social justice incentives for utilities to construct renewable energy projects in poorer neighborhoods, reducing pollution-related illness and eventually lowering electricity rates.
  • Energy efficiency is still encouraged, but has been eliminated as one of the rule’s "building blocks” for states to use in building their own carbon-reduction plans.
How will the Clean Power Plan story continue to play out?  Will it be challenged in court?  Will states comply?  What impacts will it have on the U.S. electric power industry?

Coal power plants retiring in 2015

Thursday, May 21, 2015

The U.S. portfolio of electric power plants will continue to shift in 2015, according to a federal assessment projecting that nearly 16 gigawatts (GW) of generating capacity will retire in 2015.  Most of the capacity to be retired this year is coal-fired generation.  This continues a multi-year trend away from coal, and toward natural gas and renewable resources.

According to the U.S. Energy Information Administration, nearly 16 GW of generating capacity is expected to retire in 2015.  Of this, 81% (12.9 GW) is coal-fired generation.  Generator retirements are heavily composed of coal-fired generation, split between bituminous coal (10.2 GW) and subbituminous coal (2.8 GW).  Most of this retiring coal capacity is found in the Appalachian region, with slightly more than 8 GW combined in Ohio, West Virginia, Kentucky, Virginia, and Indiana.

New environmental regulations and struggles to remain cost-competitive explain most of these retirements.  This year, the Environmental Protection Agency's Mercury and Air Toxics Standards (MATS) take effect.  MATS requires existing large coal- and oil-fired electric generators to meet stricter emissions standards by retrofitting the units with new emissions control technologies.  While some units have been granted extensions to operate through April 2016, some power plant operators are choosing to retire units instead of making cost-prohibitive investments in pollution control.

Most of the coal-fired units slated for retirement are smaller and operate at a lower capacity factor than average coal-fired units in the United States.  According to EIA, the to-be-retired units have an average summer nameplate capacity of 158 MW, just 60% as big as the 261 MW average for other coal-fired units.  In 2014, the average capacity factor for all coal units was 61%, but the subset of coal units retiring in 2015 had an average capacity factor of just 36%.  The relatively small size and low capacity factor of these power plants make it harder for them to compete economically against other generation sources.  This competition is especially difficult if sufficient natural gas-fired generating capacity is available, as the cost of natural gas has fallen to levels not seen since 2012.

The coal capacity retiring in 2015 accounted for 1.6% of total U.S. generation during 2014.  At the same time, electric generating companies expect to add more than 20 GW of utility-scale generating capacity to the power grid.  This new capacity is dominated by wind (9.8 GW), natural gas (6.3 GW), and solar (2.2 GW), which together compose 91% of expected new capacity in 2015.

FERC 2014 State of the Markets report

Monday, March 23, 2015


U.S. energy markets overseen by the Federal Energy Regulatory Commission in 2014 were impacted by extreme weather and changes in the mix of electric generation resources, according to a report by Commission staff.

The 2014 State of the Markets report issued on March 19 by FERC's Office of Enforcement’s Division of Energy Market Oversight presents Commission's staff’s assessment of recent developments in natural gas, electric, and other energy markets.

Extreme cold temperatures in the first quarter of 2014 affected natural gas infrastructure and power markets across the country.  The price of natural gas in the U.S. reached record high levels, driving corresponding spikes in the price of electricity.  For example, the price of natural gas at the Transco Zone 6 Non-NY pricing point hit $123/MMBtu in January -- about 33 times higher than the average 2013 U.S. price.  Largely due to these price spikes, the spot natural gas price at the Henry Hub pricing point averaged $4.32/MMBtu in 2014, a 16% increase over 2013.

Meanwhile, natural gas and renewable resources continued to displace coal as a fuel for electric power generation.  Total U.S. generating capacity increased 10.8 GW in 2014, with natural gas and renewable projects representing the bulk of new capacity.  At the same time, utilities retired coal-fired power plants, continuing a trend that started in 2012.  Commission staff projects continued coal retirements in 2015, particularly after the April effective date of additional air emissions regulations imposed by the Environmental Protection Agency's Mercury and Air Toxics Standards.

FERC's 2014 State of the Markets report also provides a quick look at 2015 year-to-date market performance.  Wholesale electricity prices rose again this winter, although not as sharply as in the first quarter of 2014.  FERC staff's report suggests factors helping to moderate winter prices included better cold-weather preparation of assets, programs like ISO New England's Winter Reliability Program, better coordination between operators of electric transmission and natural gas pipelines, record high levels of natural gas production, the development of new pipeline infrastructure, and low oil prices.

2014: natural gas, wind, solar led new projects

Friday, January 30, 2015

Natural gas, wind, and solar power projects dominated the rankings of new U.S. electric generation placed in service in 2014.

According to the Federal Energy Regulatory Commission staff's December 2014 Energy Infrastructure Update, developers placed in service 15,384 megawatts of new utility-scale electric generation capacity in 2014.  This new capacity buildout is within 4% of 2013's figure (15,886 megawatts).

Of 2014's new generating capacity, nearly half (7,485 megawatts, or 49%) is powered by natural gas.  U.S. production of natural gas has increased significantly in recent years, and natural gas prices have decreased in most regions of the country.  At the same time, new environmental regulations have made historically dominant coal relatively more expensive as a fuel source, while relatively low carbon emissions have made natural gas more attractive.  2014 thus continued the trends of coal-fired power plant retirement and the construction of new natural gas-fired generating capacity.

Wind represents the next largest category of new U.S. electric generating capacity placed in service in 2014.  Nearly 27% of 2014's new capacity, or 4,080 megawatts, is powered by wind.  As President Obama noted in his 2015 State of the Union address, the U.S. has more wind energy supplying its electrical grid than any other country.

Solar energy represents the third largest category of new generation placed in service last year.  Over 20% of new 2014 capacity, or 3,139 megawatts, is powered by solar energy.  The rapid growth of solar energy in the U.S. was also featured in President Obama's 2015 State of the Union speech, in which he noted, "Every three weeks, we bring online as much solar power as we did in all of 2008."

Combined, these three energy sources (natural gas, wind, and solar) account for over 95% of all new utility-scale generation capacity placed in service in 2014. Of the remaining capacity, biomass took the largest share (1.6% of total new capacity), with a diverse mix of other sources including water power, coal, and nuclear rounding out the list.  Notably, renewable sources including wind, solar, biomass, and hydropower account for nearly half of all new capacity placed in service in 2014.

What will 2015 bring?

New generation in 2014 mostly gas, solar, wind

Wednesday, September 17, 2014

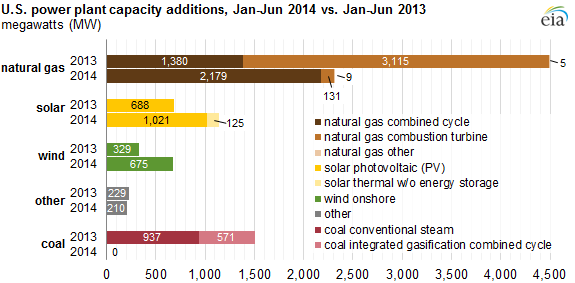
Most new power plants placed in service in the first half of 2014 are powered by natural gas, with new solar and wind capacity coming in second and third, respectively, according to the U.S. Energy Information Administration.  Meanwhile, no new coal-fired electric generating capacity was added during that period.

Source: U.S. Energy Information Administration, Electric Power Monthly, August 2014 edition with June 2014 data
Note: Data include facilities with a net summer capacity of 1 MW and above only.
From January through June 2014, EIA data shows the U.S. added 4,350 megawatts of new utility-scale generating capacity. Combined-cycle natural gas plants contributed 2,179 MW of new capacity.  Of this, over half is located at Florida Power & Light's Riviera Beach Next Generation Clean Energy Center in Florida.  New combustion turbine plants added another 131 MW.  In all, natural gas powers over 53% of new capacity coming online in the first half of 2014.  Most of the nation has access to low cost natural gas, which offers significant environmental benefits over other fossil fuels like coal and oil.

Solar projects came in second, with 1,146 MW of new capacity coming online.  Solar capacity is growing quickly, with an increase of almost 70% in new capacity added over the same period in 2013.  Nearly 75% of this solar capacity is located in California, with most of the rest in Arizona, Nevada, and Massachusetts.  Notably, the EIA's data only covers utility-scale projects; it omits most rooftop solar projects and any other solar capacity additions below 1 MW in size.

New wind capacity came in third, with 675 MW added.  Most of the new capacity is sited in California, Nebraska, Michigan, and Minnesota.

Coal was notably absent from the ranks of new generating capacity added in the first half of 2014.  New coal plants face steep headwinds in the form of environmental regulations and stiff competition against natural gas plants.  EIA reports that only two coal plants are planned to come online in 2014.

As regulations and market forces shape the nation's energy mix, where will the new equilibrium be found -- and for how long?

Report projects modest need for electric generation capacity growth

Thursday, July 24, 2014

The U.S. Energy Information Administration has projected that 351 gigawatts of new electric generating capacity will be added to the U.S. grid between 2013 and 2040.  This projected new capacity, most of which EIA expects to be fueled by natural gas, will replace older power plants as they retire, as well as modestly increasing the country's net installed capacity.

EIA's forecast implies a growth rate well below recent annual levels observed.  Under EIA's projection, capacity additions through 2016 will average 16 GW per year.  But from 2017 through 2022, EIA expects additions of less than 9 GW per year as the existing generating fleet will be sufficient to meet expected demand growth in most regions.  From 2025 to 2040, annual additions increase to an average 14 GW per year, but remain below recent levels.

EIA expects that natural gas will be the primary fuel source for the projected added capacity, accounting for 73% of capacity additions in the reference case (or 255 GW).

Renewables will account for 24% of the new capacity (or 83 MW).  Of renewable capacity additions, 39 GW are solar photovoltaic (PV) systems (60% of which are rooftop installations).  Another 28 GW are wind, most of which will occur by 2015 to qualify for federal renewable energy production tax credits).

New nuclear capacity will total about 3% (or 10 GW), including 6 GW of plants currently under construction and 4 GW projected after 2027.

EIA also projects that 1% of capacity additions (or less than 3 GW) will come from coal, with more than 80% of that total currently under construction.  EIA notes that federal and state environmental regulations and uncertainty about future limits on greenhouse gas emissions reduce the attractiveness and economic merits of coal-fired plants.

Like any forecast, EIA's projections rest upon a series of assumptions.  Under alternative cases, we might experience actual capacity additions that differ from EIA's forecasts.  Nevertheless, the EIA Annual Energy Outlook 2014 offers a glimpse of changes to the portfolio composing our energy mix may come in the next decades.

EPA proposes carbon goals for power plants

Monday, June 2, 2014

The U.S. Environmental Protection Agency has proposed its plan to reduce carbon emissions from the nation's power plants by 30% below 2005 levels.

Stacks rise from the coal-fired Salem Harbor Station power plant, which closed on June 1, 2014.

Formally known as "Carbon Pollution Emission Guidelines for Existing Stationary Sources: Electric Utility Generating Units", EPA's proposed rule spans 645 pages (PDF).  The so-called Clean Power Plan builds on President Obama's 2013 Climate Action Plan, relying on the agency's authority under Section 111(d) of the Clean Air Act.  Generally, Section 111 provides for the establishment of nationwide emission standards for major stationary sources of air pollution such as power plants.  Current regulations limit power plants' emissions of arsenic, mercury, sulfur dioxide, nitrogen oxides, and particle pollution, but there are currently no national limits on carbon pollution levels.

EPA's Clean Power Plan would, for the first time, provide federal regulation of power plants' carbon emissions.  EPA envisions a collaborative process through which federal limits are established for each state, but where states have the flexibility to identify their own path forward using either current or new electricity production and pollution control policies to meet the goals of the proposed program.  Each state's carbon emissions limit would be stated as a rate of allowable pounds of carbon emissions per megawatt-hour of electric energy generated.  EPA would set these rates based on a case-by-case evaluation of each state's energy mix -- including its portfolio of generation resources -- and EPA's evaluation of opportunities to reduce carbon emissions.

States would then be free to design a program to achieve those rates in a way that makes the most sense for each state's unique situation, combining diverse fuels, energy efficiency and demand-side management to create a tailored solution for each state. EPA also envisions collaboration among states, including the development of multi-state plans.  Some states have already organized collaborative programs to reduce the electric power sector's carbon emissions -- for example, the Regional Greenhouse Gas Initiative (RGGI) program in the eastern states

If adopted, EPA's rule would require states to submit their plans to EPA for review in June 2016.  But EPA's plan is not yet final.  It first faces public comment through the summer, including public hearings during the week of July 28 in Denver, Atlanta, Washington, DC and Pittsburgh.  EPA anticipates finalizing its standards in June 2015.

Additional materials, including fact sheets and a regulatory analysis, are posted on the EPA's Clean Power Plan program website.

U.S. natural gas to pass coal as electricity fuel in 2035

Thursday, May 15, 2014

Coal will continue to fuel the largest share of electricity generated in the U.S. until 2035, when natural gas will surpass it, according to a recent federal report.

The U.S. Energy Information Administration's 2014 Annual Energy Outlook presents a long-term forecast of energy supply, demand, and prices from the present through 2040.  Its scope includes predictions about shifts in the portfolio of types of electricity generating resources used to produce power.  The largest such trend projected in EIA's 2014 report is that the market share of coal and nuclear generators will likely decline over the next two decades, as natural gas-fired and renewable electricity sources grow in prominence.

Historically, coal has fueled the largest share of electricity generated in the U.S.  Typically operating as baseload generation, coal has traditionally been a relatively low-cost fuel for electric production.  Coal's share of the electricity mix peaked in 2007, at 49% of all electric power generated.  Since then, coal's share has declined; in 2012, coal-fired generators produced 39% of all electricity generated by utilities -- still the largest piece of the generation portfolio, despite a significant decline.

Coal's role in the nation's energy mix is under challenge from multiple fronts.  Economically, the increased availability of lower-cost natural gas has made coal less competitive.  Meanwhile, tighter environmental regulations -- such as the U.S. Environmental Protection Agency's Mercury and Air Toxics Standards, or MATS rules -- have placed additional pressure on coal plant operators to either invest in upgraded environmental controls or shut down.

At the end of 2012, 310 gigawatts of coal-fired generating capacity was available to run in the U.S.  Of that, EIA projects that 50 gigawatts will be retired by 2020 under its base case model.

Under EIA's model, natural gas will grow its market share while coal declines.  EIA projects that 70% of all new capacity added before 2040 will be fueled by natural gas.  If EIA's assumptions hold, natural gas will surpass coal as a fuel for electricity generation in 2035.

While EIA's model rests on a series of assumptions, all of the alternative cases examined by EIA assume that coal-fired capacity will be retired, while natural gas-fired and renewable generation will grow.  What will the future hold for the U.S. energy mix?

Biofuels lead growth in U.S. biomass energy

Monday, March 24, 2014

The use of energy from biomass resources in the United States grew more than 60% over the decade between 2002 and 2013 -- primarily in the form of increased use of biofuels like ethanol and biodiesel that are produced from biomass.

A fuel pump displays prices for gasoline blended with up to 10% ethanol.

According to the U.S. Energy Information Administration, biomass accounted for about half of all renewable energy consumed in 2013 and 5% of total U.S. energy consumed. The three primary sources of this biomass are wood and forest products byproducts, waste including municipal solid waste and landfill gas, and raw organic feedstocks like corn and soybean oil used to produce biofuels.

Of biomass energy resources, biofuels experienced the greatest growth over the last decade. From 2002 to 2013, biofuels created from biomass grew more than 500%, driven largely by increases in U.S. production of ethanol and biodiesel for blending as transportation fuels. These biofuels are typically produced from feedstocks such as agricultural crops and other plant material, animal byproducts, and recycled waste. For U.S. ethanol production, corn is the dominant feedstock, while biodiesel producers rely on soybean oil for just over half of feedstock needs and an array of biomass resources for the rest. Market demand for these biofuels comes in part from federal mandates such as the U.S. Environmental Protection Agency's Renewable Fuel Standard, which requires the blending of certain volumes of biofuels into gasoline and diesel.

Meanwhile, EIA data shows that consumption of wood and waste energy increased just 4% over the decade. About two-thirds of U.S. wood energy is consumed for industrial processes, while nearly all U.S. waste energy is consumed for electric generation or industrial processes.

If this trend continues, woody biomass and waste energy will continue to hold their positions in our portfolio of energy resources, while continued growth in the conversion of biomass into biofuels for transportation and other needs will increase biofuels' weighting in the nation's energy mix.  At the same time, debates continue over the cost and value of programs encouraging the growth of corn as a biofuel feedstock.  What does the future hold for biomass in the U.S.?

Changes in how New England generates electricity

Tuesday, April 30, 2013

Society can use a number of different energy resources to generate electricity.  We typically rely on a portfolio of multiple fuels to meet our needs, but the composition of this energy resource mix can affect the reliability, cost and environmental impacts of electricity generation.  Through most of the twentieth century, in most regions of the United States, coal dominated the mix.  Today, new resources like natural gas and nuclear power play major roles.  The resource mix continues to evolve, with significant changes since 2000 alone.

New England provides a prime example of these shifts.  According to regional grid operator ISO New England's 2013 Regional Energy Outlook (48-page PDF), in 2000 the largest share of power generated in the region came from nuclear power (31%).  Nuclear power continued to provide a similar share of our electricity in 2012, but it has been bypassed by natural gas-fired generation as the largest source of our power.  While natural gas contributed just 15% of regional electricity in 2000, last year it provided more than half (52%) of all electricity in New England.  The growth of natural gas comes as the result of several trends, including the availability of relatively low-cost gas as well as natural gas's favorable emissions and environmental impacts compared to oil and coal.

Indeed, the amount of power generated by burning oil and coal in New England has fallen sharply.  While oil-fired generation provided 22% of our needs in 2000, last year less than 1% of our power came from oil.  The high cost of oil, combined with the availability of extensive capacity to generate electricity from natural gas, drove this marked decrease in the electric power sector's use of oil.  Likewise, coal-fueled power has declined from 18% in 2000 to just 3% in 2012.  Tighter federal air emissions standards and pollution control requirements, combined with the age of the coal-powered fleet and the availability of low-cost natural gas, have made coal-fired power largely uneconomic in New England.

According to the numbers, natural gas's ascendancy has not come at the expense of renewable power.  The share of regional electricity produced from hydropower and other renewable energy resources held steady at 13% from 2000 to 2012.

What are the implications of this shift in New England's portfolio of energy resources?  Lower average wholesale energy prices are one result.  As electricity produced from oil and coal became more expensive, the cost of electricity produced from natural gas fell.  Combined with the shift in the resource mix, these changes have led to relatively lower prices for electricity.  This price decrease has been partially offset by increases in the cost of utility transmission and distribution service, but most consumers see lower electricity prices today than they did in 2000.