Newly enacted Maine legislation establishes the Maine Climate Council to advise the Governor and state Legislature on ways to mitigate the causes of, prepare for and adapt to the consequences of climate change, and calls for significant reductions in the state's overall greenhouse gas emissions.
On June 26, 2019, Maine Governor Janet Mills signed into law An Act to Promote Clean Energy Jobs and To Establish the Maine Climate Council. One set of provisions in the new law establishes a requirement that Maine reduce gross annual greenhouse gas emissions -- to at least 45% below the 1990 gross annual greenhouse gas emissions level by 2030, at least 80% below the 1990 gross annual greenhouse gas emissions level by 2050, and on track to meet the 2050 target by 2040. The law requires the Department of Environmental Protection to adopt rules to ensure compliance with these levels, and authorizes the Department of Transportation to adopt similar rules.
Crucially, the rules must prioritize greenhouse gas emissions reductions by sectors
that are the most significant sources of greenhouse gas emissions, as
identified by the United States Energy Information Administration and in
the department's biennial reports, taking
into account gross greenhouse gas emissions reductions achieved by each
sector since 1990 and the cost-effectiveness of future
gross greenhouse gas emissions reductions by each sector. While the electricity sector has largely been decarbonized, transportation and heating lag significantly. Maine's transportation sector was responsible for 53 percent of the state's greenhouse gas emissions in 2017, with heating taking the next greatest share. Meanwhile, electricity generation in Maine accounted for just 9 percent of the state's greenhouse gas emissions.
The law also creates a 39-member Maine Climate Council, with a subcommittee for scientific and technical matters and various working groups. The Council must meet at least every three months, report annually to a legislative committee, and prepare an updated climate action plan by December 1, 2020 and every four years thereafter. The climate action plan must include a clean energy economy transition plan.

Energy powers society; society's choices shape energy policy. A blog about our energy resources and the choices they present for society.
Showing posts with label electricity. Show all posts
Showing posts with label electricity. Show all posts

U.S. to export more energy by 2020 than it imports, projects EIA
Tuesday, January 29, 2019
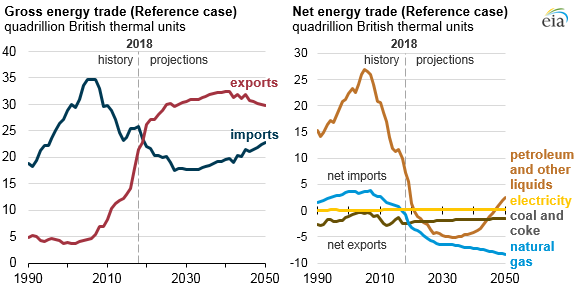
Federal energy analysts project that the United States will export more energy than it imports by 2020, making the nation a net energy exporter for the first time since the 1950s. Fossil fuels represent the largest volumes of this international trade.
The United States both exports and imports energy in a variety of forms, including natural gas, coal and coke, petroleum and other liquids, and electricity. According to the U.S. Energy Information Administration, the United States has long been a net exporter of coal and coke. In 2017, the nation began exporting more natural gas than it imports, primarily in the form of liquified natural gas or LNG. EIA notes that electricity trades with neighboring Canada and Mexico represent "a relatively small part of U.S. net energy trade flows."
The EIA projects that domestic production of crude oil, natural gas, and natural gas plant liquids will continue to grow at a faster rate than U.S. energy consumption over the next decade, meaning the balance of these fuels will be exported. EIA projects that due to "evolving trade flows of liquid fuels and natural gas," increasing exports of these fuels will tip the trade balance to where the U.S. is a net exporter of energy by 2020. When this shift occurs, it will represent the first time that the United States exports more energy than it imports on an annual basis since 1953.
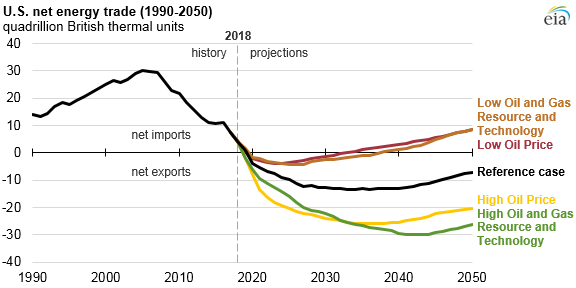
Exactly how large the nation's net exports might be -- and how long the net-exporter status might last -- depend on a variety of assumptions about matters including oil and gas prices, resource extraction technologies, and possible changes to law. Under EIA's reference case which reflects current laws and regulations, the U.S. begins exporting more energy than it imports on an annual basis in 2020 and maintains that status through 2050. In other cases featuring lower prices or extraction rates for oil and gas, EIA projects that U.S. will return to net-importer status by the mid- to late-2030s.
Changes to laws and regulations could also affect the trade balance for energy products.
 |
| Source: U.S. Energy Information Administration |
The EIA projects that domestic production of crude oil, natural gas, and natural gas plant liquids will continue to grow at a faster rate than U.S. energy consumption over the next decade, meaning the balance of these fuels will be exported. EIA projects that due to "evolving trade flows of liquid fuels and natural gas," increasing exports of these fuels will tip the trade balance to where the U.S. is a net exporter of energy by 2020. When this shift occurs, it will represent the first time that the United States exports more energy than it imports on an annual basis since 1953.
Exactly how large the nation's net exports might be -- and how long the net-exporter status might last -- depend on a variety of assumptions about matters including oil and gas prices, resource extraction technologies, and possible changes to law. Under EIA's reference case which reflects current laws and regulations, the U.S. begins exporting more energy than it imports on an annual basis in 2020 and maintains that status through 2050. In other cases featuring lower prices or extraction rates for oil and gas, EIA projects that U.S. will return to net-importer status by the mid- to late-2030s.
 |
| Source: U.S. Energy Information Administration |
Maine Gov. LePage's 2018 State of the State and energy policy
Tuesday, February 13, 2018
Maine Governor Paul R. LePage delivered his final State of the State address this evening. Here's a recap of some of his remarks on energy policy in previous speeches of that sort.
Nevertheless, the Bangor Daily News reports that his remarks as delivered did address energy, calling for lower energy prices.
- In 2012, Governor LePage described Maine’s high energy costs as "one of the largest inhibitors, if not the biggest obstacle to job creation." He advocated an energy policy encompassing "all forms of energy."
- Energy did not appear in his 2013 speech, according to a transcript provided by the Portland Press Herald.
- In 2014, Governor LePage noted that "heating and electricity costs remain a major obstacle," with homeowners spending nearly double the national average on heating, and high electricity costs posting challenges to attracting business. He described efforts to expand natural gas pipeline capacity from Pennsylvania, and to connect to clean energy resources in Quebec.
- In 2015, Governor LePage used his speech to argue for lower electricity rates and home heating costs, as well as changes to Maine’s renewable energy policies.
- In 2016, Governor LePage released his speech in the form of a letter to the state legislature. As in previous speeches, his 2016 letter mentioned energy issues as a focus for -- or obstacle to -- economic development. Arguing that Maine's electricity prices are not competitive, he criticized legislative mandates supporting "long-term contracts for above-market rates." He also called for expansion of linear infrastructure like natural gas pipelines into New England and electric transmission lines to hydropower resources in Canada.
- Last year, he returned to delivering the speech to the legislature orally. His 2017 address included a section on energy matters, in which he criticized the Public Utilities Commission's decision to amend its rules governing net energy billing. He called upon lawmakers to agree to lower energy costs, to lower carbon dioxide levels in the most cost-effective manner, and to reduce our demand for oil.
Nevertheless, the Bangor Daily News reports that his remarks as delivered did address energy, calling for lower energy prices.
NH PUC considers efficiency plan
Thursday, November 2, 2017
New Hampshire utility regulators are considering a three-year statewide energy efficiency plan proposed by several electric and gas utilities. The case could shape the near-term future of New Hampshire energy efficiency programming.
Under a 2016 settlement agreement, the New Hampshire Public Utilities Commission approved the implementation of an Energy Efficiency Resource Standard (EERS) beginning 2018, subject to Commission approval of the specific programs proposed to meet this standard. On September 1, 2017, utilities Liberty Utilities, Public Service Company of New Hampshire, Unitil Energy Systems, Inc. and Northern Utilities, Inc. jointly proposed a 2018-2020 Statewide Energy Efficiency Plan for approval by the Commission. The proposed 2018-2020 New Hampshire Statewide Energy Efficiency Plan document spans 369 pages, and is supported by testimony filed by the utilities.
As described by the utilities, their proposals would extend and expand existing "NHSaves" programs for another 3 years, and would add new initiatives including "a new residential energy audit option, a financing option for moderate income residents, new measure offerings in both residential and commercial programs, and multi -year energy planning to encourage long-term energy savings projects among large commercial customers."
According to the utilities, the measures implemented through the 2018-2020 Plan will save more than 4 billion electric kilowatt-hours and 7.5 million natural gas MMBtu, plus another 5.4 million MMBtus from other fuels, yielding customer energy cost savings of more than $867 million in energy costs over the life of the measures. The utilities also project that the measures "will reduce peak demand by 39 MW, which in tum will reduce costs for all customers."
The Commission has docketed the proceeding as Docket No. DE 17-136, and set a procedural schedule for the case including the filing of testimony and pursuit of possible settlement through November 2017, with hearings on the merits in early December.
Under a 2016 settlement agreement, the New Hampshire Public Utilities Commission approved the implementation of an Energy Efficiency Resource Standard (EERS) beginning 2018, subject to Commission approval of the specific programs proposed to meet this standard. On September 1, 2017, utilities Liberty Utilities, Public Service Company of New Hampshire, Unitil Energy Systems, Inc. and Northern Utilities, Inc. jointly proposed a 2018-2020 Statewide Energy Efficiency Plan for approval by the Commission. The proposed 2018-2020 New Hampshire Statewide Energy Efficiency Plan document spans 369 pages, and is supported by testimony filed by the utilities.
As described by the utilities, their proposals would extend and expand existing "NHSaves" programs for another 3 years, and would add new initiatives including "a new residential energy audit option, a financing option for moderate income residents, new measure offerings in both residential and commercial programs, and multi -year energy planning to encourage long-term energy savings projects among large commercial customers."
According to the utilities, the measures implemented through the 2018-2020 Plan will save more than 4 billion electric kilowatt-hours and 7.5 million natural gas MMBtu, plus another 5.4 million MMBtus from other fuels, yielding customer energy cost savings of more than $867 million in energy costs over the life of the measures. The utilities also project that the measures "will reduce peak demand by 39 MW, which in tum will reduce costs for all customers."
The Commission has docketed the proceeding as Docket No. DE 17-136, and set a procedural schedule for the case including the filing of testimony and pursuit of possible settlement through November 2017, with hearings on the merits in early December.
US designates alternative fuel corridors for transportation
Thursday, November 3, 2016
U.S. federal highway administrators have announced the designation of 55 routes as "alternative fuel" corridors, capable of accommodating electric vehicles or those powered by hydrogen, propane, or natural gas. The announcement sets the stage for further federal action supporting alternative transportation fuels.
The U.S. Department of Transportation’s Federal Highway Administration (FHWA) oversees construction and maintenance of the nation's highways, bridges, and tunnels. FHWA data suggests U.S. drivers travel over 3.15 trillion miles per year. Overall, the U.S. transportation sector is a major consumer of energy, and among the largest contributors to domestic greenhouse gas emissions.
Congress and the Obama administration are now pursuing strategies to reduce the transportation sector's greenhouse gas emissions. Electric vehicles and alternative transportation fuels form one tool in these efforts. Under a 2015 law -- Section 1413 of the Fixing America's Surface Transportation (FAST) Act -- the Secretary of Transportation is required to designate national electric vehicle (EV) charging, hydrogen, propane, and natural gas fueling corridors. In July, the Department of Transportation asked states to nominate corridors along major highways, for EVs and other alternative fuels designated in the FAST Act.
In a November 3, 2016, announcement, the FHWA unveiled its designation of the nation's first alternative fuel corridors. The network is nearly 85,000 miles long, and crosses 35 states. Some corridors have been designed as "sign-ready," meaning alternative fueling stations are operational; these corridors are eligible to feature new signs showing where drivers can refuel.
The FHWA has posted maps of its alternative fuel corridors on its website. The agency intends to add more miles in the future, as additional charging and fueling stations are built.
 |
| An electric vehicle charging station, in an underground parking garage in Boston. |
The U.S. Department of Transportation’s Federal Highway Administration (FHWA) oversees construction and maintenance of the nation's highways, bridges, and tunnels. FHWA data suggests U.S. drivers travel over 3.15 trillion miles per year. Overall, the U.S. transportation sector is a major consumer of energy, and among the largest contributors to domestic greenhouse gas emissions.
Congress and the Obama administration are now pursuing strategies to reduce the transportation sector's greenhouse gas emissions. Electric vehicles and alternative transportation fuels form one tool in these efforts. Under a 2015 law -- Section 1413 of the Fixing America's Surface Transportation (FAST) Act -- the Secretary of Transportation is required to designate national electric vehicle (EV) charging, hydrogen, propane, and natural gas fueling corridors. In July, the Department of Transportation asked states to nominate corridors along major highways, for EVs and other alternative fuels designated in the FAST Act.
In a November 3, 2016, announcement, the FHWA unveiled its designation of the nation's first alternative fuel corridors. The network is nearly 85,000 miles long, and crosses 35 states. Some corridors have been designed as "sign-ready," meaning alternative fueling stations are operational; these corridors are eligible to feature new signs showing where drivers can refuel.
The FHWA has posted maps of its alternative fuel corridors on its website. The agency intends to add more miles in the future, as additional charging and fueling stations are built.
ISONE External Market Monitor report 2015
Monday, July 11, 2016
A report by the New England electricity market's external monitor has found that "the markets performed competitively in 2015."
ISO New England operates wholesale electricity markets covering most of New England. It employs two independent market monitors -- one internal to ISO-NE, one a hired external consultant -- to regularly review, analyze, and report on market results, and offer recommendations on market improvements.
Potomac Economics serves as the External Market Monitor for ISO-NE. In this role, it is charged with evaluating the competitive performance, design, and operation of the wholesale electricity markets operated by ISO-NE. Last month, the external market monitor released its "2015 Assessment of the ISO New England Electricity Markets" (102-page PDF), presenting its perspective on the New England electricity markets.
Among other findings, the report notes that energy market trends "have been dominated by reductions in fuel prices over the last two years. In particular, from 2014 to 2015:
ISO New England's internal market monitor released its 2015 Annual Markets Report earlier this year. That report similarly found that overall, "the ISO New England capacity, energy, and ancillary service markets performed well in 2015."
ISO New England operates wholesale electricity markets covering most of New England. It employs two independent market monitors -- one internal to ISO-NE, one a hired external consultant -- to regularly review, analyze, and report on market results, and offer recommendations on market improvements.
Potomac Economics serves as the External Market Monitor for ISO-NE. In this role, it is charged with evaluating the competitive performance, design, and operation of the wholesale electricity markets operated by ISO-NE. Last month, the external market monitor released its "2015 Assessment of the ISO New England Electricity Markets" (102-page PDF), presenting its perspective on the New England electricity markets.
Among other findings, the report notes that energy market trends "have been dominated by reductions in fuel prices over the last two years. In particular, from 2014 to 2015:
- Natural gas prices declined more than 40 percent, falling to multi -year lows in mid -2015 largely because of higher shale production from the Marcellus and Utica regions; and
- Fuel oil prices fell by more than 35 percent because of increased global supply, and world liquefied natural gas (LNG) prices have fallen similarly. These reductions helped limit the increase in natural gas prices during tight gas supply conditions in the winter.
ISO New England's internal market monitor released its 2015 Annual Markets Report earlier this year. That report similarly found that overall, "the ISO New England capacity, energy, and ancillary service markets performed well in 2015."
Vermont issues updated energy plan
Monday, February 8, 2016
Vermont energy regulators have completed an update of key energy and electricity plans for that state. The Vermont Department of Public Service has updated the Vermont Comprehensive Energy Plan (CEP) and Electric Plan, two plans required by law to be complete and adopted by January 1, 2016, and updated every six years thereafter.
The updated Comprehensive Energy Plan reaffirms Vermont's overall goal of achieving 90 percent of its total energy needs from renewable sources by 2050, adds interim goals (including reaffirming the statutory goal of 25% by 2025), and provides greater detail on Vermont’s pathways towards achieving these goals. In particular, the plan includes the following new and more detailed goals:
The updated Comprehensive Energy Plan reaffirms Vermont's overall goal of achieving 90 percent of its total energy needs from renewable sources by 2050, adds interim goals (including reaffirming the statutory goal of 25% by 2025), and provides greater detail on Vermont’s pathways towards achieving these goals. In particular, the plan includes the following new and more detailed goals:
- Reduce total energy consumption per capita by 15% by 2025, and by more than one third by 2050.
- Meet 25% of the remaining energy need from renewable sources by 2025, 40% by 2 035, and 90% by 2050.
- Three end-use sector goals for 2025: 10% renewable transportation, 30% renewable buildings, and 67% renewable electric power.
- Greenhouse gas reduction goals include: 40% reduction below 1990 levels by 2030, and 80% to 95% reduction below 1990 levels by 2050.
Record low prices in summer 2015 New England wholesale electricity market
Tuesday, November 3, 2015
The summer of 2015 brought New England the lowest wholesale
electricity prices since 2003, thanks to record low prices for natural
gas. According to regional grid operator ISO New England Inc., this
illustrates what happens "when New England power plants can access the
vast supply
of lower-priced, domestic natural gas being produced in the Marcellus
shale deposit."
In a post on its ISO Newswire site, the grid operator noted that the average real-time wholesale electricity price for June, July, and August 2015 was $26.86 per megawatt-hour (MWh). By comparison, the average real-time price of wholesale electric energy in 2014 was $63.32 per megawatt-hour. While summer energy prices have typically averaged lower than winter prices in New England, 2015's summer prices were low even in comparison to other recent summers: $34.31 in 2014, or $43.94 in 2013.
What explains New England's low wholesale electricity prices this summer? According to ISO New England, it's because existing natural gas-fired power plants could get fuel at a low price:
New England's average summer electricity price was even below that of other regions, like the Midwest. According to ISO-NE, "This summer’s prices indicate that the region’s electricity prices can be competitive, in the more commonly understood sense, with other regions of the US when low-cost fuel is available." Indeed, at times the price of natural gas in New England was below that of the benchmark Henry Hub.
The post also describes how heavy winter demand for natural gas for both heating and power generation, combined with pipeline constraints, yields high natural gas prices and thus high electricity prices. This has occurred repeatedly in recent winters, such as in January and February 2014 and February 2015. What is at issue is thus the ability of the interstate natural gas pipeline transportation network to ship enough gas into the Northeast -- a capability exceeded through much of the recent winters, with the resulting price paid in coal and oil emissions as well as dollars.
As ISO-NE notes, most customers' retail rates for electricity are set using mechanisms to reduce rate volatility, and time of use rates are not yet widely adopted. But the net movement of wholesale markets is eventually priced into retail rates. Can New England keep competitive with other regions?
 |
| ISO-NE, "Summer 2015: The lowest natural gas and power prices since 2003" |
In a post on its ISO Newswire site, the grid operator noted that the average real-time wholesale electricity price for June, July, and August 2015 was $26.86 per megawatt-hour (MWh). By comparison, the average real-time price of wholesale electric energy in 2014 was $63.32 per megawatt-hour. While summer energy prices have typically averaged lower than winter prices in New England, 2015's summer prices were low even in comparison to other recent summers: $34.31 in 2014, or $43.94 in 2013.
What explains New England's low wholesale electricity prices this summer? According to ISO New England, it's because existing natural gas-fired power plants could get fuel at a low price:
In essence, the reason was the low price of natural gas that could be delivered to the power plants that burn natural gas to make electricity. For most of the year, the price of natural gas is low in New England, and as a consequence, the demand for natural gas for both heating and power generation just continues to grow. In fact, in 2014, New England power generators using natural gas produced 44% of the region’s electricity.The ISO-NE post describes how low-priced natural gas plus adequate interstate pipeline transportation capacity yields New England low electricity prices. Indeed, the average price of natural gas in New England during June, July, and August averaged a record low $2/MMBtu. This is nearly 40% below last year's summer average ($3.27/MMBtu), itself the next-lowest summer record.
New England's average summer electricity price was even below that of other regions, like the Midwest. According to ISO-NE, "This summer’s prices indicate that the region’s electricity prices can be competitive, in the more commonly understood sense, with other regions of the US when low-cost fuel is available." Indeed, at times the price of natural gas in New England was below that of the benchmark Henry Hub.
The post also describes how heavy winter demand for natural gas for both heating and power generation, combined with pipeline constraints, yields high natural gas prices and thus high electricity prices. This has occurred repeatedly in recent winters, such as in January and February 2014 and February 2015. What is at issue is thus the ability of the interstate natural gas pipeline transportation network to ship enough gas into the Northeast -- a capability exceeded through much of the recent winters, with the resulting price paid in coal and oil emissions as well as dollars.
As ISO-NE notes, most customers' retail rates for electricity are set using mechanisms to reduce rate volatility, and time of use rates are not yet widely adopted. But the net movement of wholesale markets is eventually priced into retail rates. Can New England keep competitive with other regions?
Cross-border infrastructure and presidential permits
Wednesday, August 26, 2015
A recent report casts doubt on whether proposed federal legislation would actually accelerate decisions on the siting of cross-border energy infrastructure.
Cross-border pipelines and electric transmission lines play an important role in the North American energy industry. Under U.S. law, cross-border energy infrastructure projects require a presidential permit and a finding of consistency with the national interest. Executive orders give the State Department jurisdiction over cross-border oil pipelines, the Department of Energy jurisdiction over electric transmission lines, and the Federal Energy Regulatory Commission jurisdiction over natural gas pipelines.
Recent projects like the Keystone XL pipeline have focused attention on the presidential permit process, as that project's presidential permit application has remained pending for years. Some have raised questions about the scope of agency review and perceived differences in the approaches taken by the State Department, Energy Department, and FERC.
As a result, several members of Congress have proposed legislation designed to accelerate the permitting process. These bills include:
These bills take various approaches, including limiting agency jurisdiction over cross-border energy infrastructure or the scope of agency review, or setting strict deadlines for agency action following completion of environmental review.
Could federal legislation like this speed up the process for reviewing proposed cross-border pipeline and electric transmission projects? A recent report by the Congressional Research Service suggests that overall timelines for project review are driven by the scope of the environmental review process, not by delays following that environmental review or agency idiosyncrasies.
In particular, the report found that agency review is "driven largely by the National Environmental Policy Act (NEPA)", which requires federal agencies to consider the environmental impacts before acting. Moreover, the report notes that the same NEPA requirements apply to all three:
Cross-border pipelines and electric transmission lines play an important role in the North American energy industry. Under U.S. law, cross-border energy infrastructure projects require a presidential permit and a finding of consistency with the national interest. Executive orders give the State Department jurisdiction over cross-border oil pipelines, the Department of Energy jurisdiction over electric transmission lines, and the Federal Energy Regulatory Commission jurisdiction over natural gas pipelines.
Recent projects like the Keystone XL pipeline have focused attention on the presidential permit process, as that project's presidential permit application has remained pending for years. Some have raised questions about the scope of agency review and perceived differences in the approaches taken by the State Department, Energy Department, and FERC.
As a result, several members of Congress have proposed legislation designed to accelerate the permitting process. These bills include:
- the Keystone XL Pipeline Approval Act (S. 1): passed in Congress but vetoed by President Obama
- the American Energy Renaissance Act of 2015 (S. 791 and H.R. 1487)
- the North American Energy Infrastructure Act (S. 1228)
These bills take various approaches, including limiting agency jurisdiction over cross-border energy infrastructure or the scope of agency review, or setting strict deadlines for agency action following completion of environmental review.
Could federal legislation like this speed up the process for reviewing proposed cross-border pipeline and electric transmission projects? A recent report by the Congressional Research Service suggests that overall timelines for project review are driven by the scope of the environmental review process, not by delays following that environmental review or agency idiosyncrasies.
In particular, the report found that agency review is "driven largely by the National Environmental Policy Act (NEPA)", which requires federal agencies to consider the environmental impacts before acting. Moreover, the report notes that the same NEPA requirements apply to all three:
Faced with Presidential Permit applications for energy projects of similar physical scope, the agencies appear to perform NEPA reviews of similar proportion. Very short, smaller projects are generally reviewed more narrowly and quickly, whereas multi-state projects of large capacity are subject to more expansive environmental review and tend to face much greater public scrutiny and comment—regardless of which agency has jurisdiction.The report also found that NEPA review is the key driver of overall permitting decision timelines:
As long as agencies apply NEPA to Presidential Permitting decisions, changes to the delineation of, or jurisdiction over, the border-crossing portion of large projects for permitting purposes may not change the scope of project environmental review. The imposition of decision deadlines on the permitting agencies after NEPA review is complete, either for national interest or public interest determination, could provide greater process certainty to stakeholders. However, the overall project review would still be contingent on the completion of NEPA review. Thus, the effects of legislative proposals to change cross-border infrastructure permitting on the review or approval of future border crossing energy infrastructure projects are open to debate.It's unclear how the Congressional Research Service report will affect pending legislation. Likely more influential may be any final action by the State Department on the Keystone XL project's application for a presidential permit. Nevertheless, interest in cross-border energy trade will likely continue to grow.
Regulators release updated energy primer
Friday, July 31, 2015
The Federal Energy Regulatory Commission has released an updated version of its "resource manual", Energy Primer: A Handbook of Energy Market Basics.
The FERC is an independent federal agency that regulates a variety of aspects of the U.S. energy industry, including the interstate transmission of electricity, natural gas, and oil, proposals to build liquefied natural gas (LNG) terminals and interstate natural gas pipelines, and hydropower projects, as well as engaging in strategic planning.
FERC's Office of Enforcement is charged with encouraging compliance with the Commission’s statutes, rules, and orders. Within the enforcement office, the Division of Energy Market Oversight is responsible for monitoring and overseeing the nation’s wholesale natural gas and electric power markets.
In 2012, the Division of Energy Market Oversight (or DEMO) issued the first edition of its Energy Primer. This week, DEMO issued an updated 2015 version of the Energy Primer. As with the previous edition, the 2015 Energy Primer gives the public a broad overview of the physical wholesale markets for natural gas and electricity and energy-related financial markets. As FERC has noted, the revised edition reflects some of the changes that have occurred in the industry since 2012, including the growth in natural gas supplies and the expansion of organized electric markets under Independent System Operators (ISO) and Regional Transmission Organizations (RTO).
The 2015 FERC Energy Primer offers a useful introduction to the U.S. energy industry as it is regulated by FERC. As with the 2012 version, FERC staff states that the 2015 edition is intended to be used as either a text or a reference guide. FERC's website also notes that the Energy Primer is a product of FERC staff and does not reflect the views of the Commission or any individual Commissioner. Nevertheless it may offer careful readers insight into how Commission staff view the markets' continuing evolution.
The FERC is an independent federal agency that regulates a variety of aspects of the U.S. energy industry, including the interstate transmission of electricity, natural gas, and oil, proposals to build liquefied natural gas (LNG) terminals and interstate natural gas pipelines, and hydropower projects, as well as engaging in strategic planning.
FERC's Office of Enforcement is charged with encouraging compliance with the Commission’s statutes, rules, and orders. Within the enforcement office, the Division of Energy Market Oversight is responsible for monitoring and overseeing the nation’s wholesale natural gas and electric power markets.
In 2012, the Division of Energy Market Oversight (or DEMO) issued the first edition of its Energy Primer. This week, DEMO issued an updated 2015 version of the Energy Primer. As with the previous edition, the 2015 Energy Primer gives the public a broad overview of the physical wholesale markets for natural gas and electricity and energy-related financial markets. As FERC has noted, the revised edition reflects some of the changes that have occurred in the industry since 2012, including the growth in natural gas supplies and the expansion of organized electric markets under Independent System Operators (ISO) and Regional Transmission Organizations (RTO).
The 2015 FERC Energy Primer offers a useful introduction to the U.S. energy industry as it is regulated by FERC. As with the 2012 version, FERC staff states that the 2015 edition is intended to be used as either a text or a reference guide. FERC's website also notes that the Energy Primer is a product of FERC staff and does not reflect the views of the Commission or any individual Commissioner. Nevertheless it may offer careful readers insight into how Commission staff view the markets' continuing evolution.
ISO-NE projects slow growth in electricity demand
Wednesday, May 13, 2015
New England's electric grid operator predicts slow growth in annual energy usage in the region over the next decade, with slightly quicker growth in peak demand.
ISO New England, Inc. develops an annual long-term load forecast using factors including state and regional economic forecasts and 40 years of weather history. Its most recent baseline forecast projects a compound annual growth rate of 1.0% in total energy usage in New England from 2015 to 2024. For 2015, ISO-NE projects 138,745 gigawatt-hours (GWh) of load, growing to 152,280 GWh in 2024.
ISO-NE's forecast also projects future peak demand, a measure of the highest amount of electricity used in a single hour in New England. Often, peak demand drives the need for constructing and maintaining power plants and transmission lines (and energy efficiency investments). According to the latest ISO-NE forecast, New England's peak electricity demand is projected to rise by a compound annual growth rate of 1.3%, from 28,395 MW this year to 31,905 MW in 2024.
These baseline projections for future peak demand and energy usage take into account load reductions that can be expected from future installations of distributed solar photovoltaic facilities. ISO-NE has prepared a separate Distributed Generation Forecast to estimate the load-reducing effects of distributed solar facilities developed as a result of state policy goals.
ISO-NE's baseline projections do not account for significant energy-efficiency savings, neither those committed through the region’s three-year Forward Capacity Market (FCM) nor future savings that can be expected beyond the FCM timeframe.
 |
| A Maine power plant -- the ecomaine Waste-to-Energy plant in Portland, Maine. |
ISO New England, Inc. develops an annual long-term load forecast using factors including state and regional economic forecasts and 40 years of weather history. Its most recent baseline forecast projects a compound annual growth rate of 1.0% in total energy usage in New England from 2015 to 2024. For 2015, ISO-NE projects 138,745 gigawatt-hours (GWh) of load, growing to 152,280 GWh in 2024.
ISO-NE's forecast also projects future peak demand, a measure of the highest amount of electricity used in a single hour in New England. Often, peak demand drives the need for constructing and maintaining power plants and transmission lines (and energy efficiency investments). According to the latest ISO-NE forecast, New England's peak electricity demand is projected to rise by a compound annual growth rate of 1.3%, from 28,395 MW this year to 31,905 MW in 2024.
These baseline projections for future peak demand and energy usage take into account load reductions that can be expected from future installations of distributed solar photovoltaic facilities. ISO-NE has prepared a separate Distributed Generation Forecast to estimate the load-reducing effects of distributed solar facilities developed as a result of state policy goals.
ISO-NE's baseline projections do not account for significant energy-efficiency savings, neither those committed through the region’s three-year Forward Capacity Market (FCM) nor future savings that can be expected beyond the FCM timeframe.
Obama links climate and health
Thursday, April 9, 2015
President Obama has issued a Presidential Proclamation declaring this week, April 6-12, 2015, as National Public Health Week. Climate change, and its impacts on human and environmental health, figure prominently in his proclamation.
The Obama administration has focused on climate change since taking office in 2009. In 2013, President Obama released his administration's Climate Action Plan, calling for reductions in U.S. emissions of carbon and greenhouse gases, adoption of mitigation and adaptation measures, and global action. He has also addressed climate change in his State of the Union speeches to Congress, and the U.S. Environmental Protection Agency has issued its proposed Clean Power Plan to reduce the carbon intensity of the nation's electric power sector.
While interest in addressing climate change arises from a broad range of factors, health plays an important role in the Obama administration's action on climate issues. In this week's Presidential Proclamation on health, President Obama noted the interdependence of climate, environment, and human health:
The Obama administration also announced an expansion of its Climate Data Initiative to include more than 150 health-relevant datasets on climate.data.gov. President Obama unveiled the Climate Data Initiative in 2014 to host data related to climate change that can help inform and prepare businesses and citizens for the impacts of extreme weather. The newly released datasets are designed to help the public answer questions, including:
The Obama administration has focused on climate change since taking office in 2009. In 2013, President Obama released his administration's Climate Action Plan, calling for reductions in U.S. emissions of carbon and greenhouse gases, adoption of mitigation and adaptation measures, and global action. He has also addressed climate change in his State of the Union speeches to Congress, and the U.S. Environmental Protection Agency has issued its proposed Clean Power Plan to reduce the carbon intensity of the nation's electric power sector.
While interest in addressing climate change arises from a broad range of factors, health plays an important role in the Obama administration's action on climate issues. In this week's Presidential Proclamation on health, President Obama noted the interdependence of climate, environment, and human health:
America's public health is deeply tied to the health of our environment. As our planet becomes more interconnected and our climate continues to warm, we face new threats to our safety and well-being. In the past three decades, the percentage of Americans with asthma has more than doubled, and climate change is putting these individuals and many other vulnerable populations at greater risk of landing in the hospital. Rising temperatures can lead to more smog, longer allergy seasons, and an increased incidence of extreme-weather-related injuries and illnesses.This week the Obama administration announced further actions to protect communities against the impacts of climate change. These actions include convening stakeholders to prepare for a White House Climate Change and Health Summit later this spring that will feature the Surgeon General, and an Adaptation in Action Report by the Centers for Disease Control and Prevention (CDC).
My Administration is dedicated to combating the health impacts of climate change. As part of my Climate Action Plan, we have proposed the first-ever carbon pollution limits for existing power plants -- standards that would help Americans live longer, healthier lives. And as we continue to ensure the resilience of our health care system, we are working to prepare our health care facilities to handle the effects of a changing planet. Climate change is no longer a distant threat. Its effects are felt today, and its costs can be measured in human lives. Every person, every community, and every nation has a duty to protect the health of all our children and grandchildren, and my Administration is committed to leading this effort.
The Obama administration also announced an expansion of its Climate Data Initiative to include more than 150 health-relevant datasets on climate.data.gov. President Obama unveiled the Climate Data Initiative in 2014 to host data related to climate change that can help inform and prepare businesses and citizens for the impacts of extreme weather. The newly released datasets are designed to help the public answer questions, including:
- In what ways does the changing climate affect public health where I live?
- What risk factors make individuals or communities more vulnerable to climate-related health effects?
- How can public health agencies, communities, and individuals plan for uncertain future conditions?
FERC 2014 State of the Markets report
Monday, March 23, 2015
U.S. energy markets overseen by the Federal Energy Regulatory Commission in 2014 were impacted by extreme weather and changes in the mix of electric generation resources, according to a report by Commission staff.
The 2014 State of the Markets report issued on March 19 by FERC's Office of Enforcement’s Division of Energy Market Oversight presents Commission's staff’s assessment of recent developments in natural gas, electric, and other energy markets.
Extreme cold temperatures in the first quarter of 2014 affected natural gas infrastructure and power markets across the country. The price of natural gas in the U.S. reached record high levels, driving corresponding spikes in the price of electricity. For example, the price of natural gas at the Transco Zone 6 Non-NY pricing point hit $123/MMBtu in January -- about 33 times higher than the average 2013 U.S. price. Largely due to these price spikes, the spot natural gas price at the Henry Hub pricing point averaged $4.32/MMBtu in 2014, a 16% increase over 2013.
Meanwhile, natural gas and renewable resources continued to displace coal as a fuel for electric power generation. Total U.S. generating capacity increased 10.8 GW in 2014, with natural gas and renewable projects representing the bulk of new capacity. At the same time, utilities retired coal-fired power plants, continuing a trend that started in 2012. Commission staff projects continued coal retirements in 2015, particularly after the April effective date of additional air emissions regulations imposed by the Environmental Protection Agency's Mercury and Air Toxics Standards.
FERC's 2014 State of the Markets report also provides a quick look at 2015 year-to-date market performance. Wholesale electricity prices rose again this winter, although not as sharply as in the first quarter of 2014. FERC staff's report suggests factors helping to moderate winter prices included better cold-weather preparation of assets, programs like ISO New England's Winter Reliability Program, better coordination between operators of electric transmission and natural gas pipelines, record high levels of natural gas production, the development of new pipeline infrastructure, and low oil prices.
US to auction Massachusetts offshore wind sites
Wednesday, December 3, 2014
The U.S. Department of the Interior has announced plans to auction more than 742,000 acres offshore Massachusetts for commercial wind energy development.
On January 29, 2015, the Department's Bureau of Ocean Energy Management will hold a competitive commercial lease sale for the rights to site offshore wind facilities in the federally designated Massachusetts Wind Energy Area. Generally located south of the islands of Martha's Vineyard and Nantucket, the area will be auctioned as four leases. It starts about 12 nautical miles offshore Massachusetts; from its northern boundary, the area extends 33 nautical miles southward and runs about 47 nautical miles from east to west. The Massachusetts Wind Energy Area is significantly larger than previously auctioned areas off Massachusetts, Rhode Island, Virginia, and Maryland. The U.S. Department of Energy’s National Renewable Energy Laboratory has estimated that fully developing the Massachusetts area could support between 4 and 5 gigawatts of commercial wind generation.
BOEM has found twelve companies to be legally, technically and financially qualified to participate in the auction for the Massachusetts Wind Energy Area:
The Massachusetts auction will be the fourth competitive lease sale for renewable energy on the Outer Continental Shelf, following previous auctions for sites off Massachusetts-Rhode Island, Virginia and Maryland. Bidders winning previous auctions have committed over $14 million in bids to secure over 357,500 acres in federal waters. BOEM expects to hold another lease auction for sites offshore New Jersey in 2015.
On January 29, 2015, the Department's Bureau of Ocean Energy Management will hold a competitive commercial lease sale for the rights to site offshore wind facilities in the federally designated Massachusetts Wind Energy Area. Generally located south of the islands of Martha's Vineyard and Nantucket, the area will be auctioned as four leases. It starts about 12 nautical miles offshore Massachusetts; from its northern boundary, the area extends 33 nautical miles southward and runs about 47 nautical miles from east to west. The Massachusetts Wind Energy Area is significantly larger than previously auctioned areas off Massachusetts, Rhode Island, Virginia, and Maryland. The U.S. Department of Energy’s National Renewable Energy Laboratory has estimated that fully developing the Massachusetts area could support between 4 and 5 gigawatts of commercial wind generation.
BOEM has found twelve companies to be legally, technically and financially qualified to participate in the auction for the Massachusetts Wind Energy Area:
- Deepwater Wind New England, LLC
- EDF Renewable Development, Inc.
- Energy Management, Inc.
- Fishermen’s Energy, LLC
- Green Sail Energy, LLC
- IBERDROLA RENEWABLES, Inc.
- NRG Bluewater Wind Massachusetts, LLC
- OffshoreMW, LLC
- RES America Developments, Inc.
- Sea Breeze Energy, LLC
- US Mainstream Renewable Power (Offshore), Inc.
- U.S. Wind, Inc.
The Massachusetts auction will be the fourth competitive lease sale for renewable energy on the Outer Continental Shelf, following previous auctions for sites off Massachusetts-Rhode Island, Virginia and Maryland. Bidders winning previous auctions have committed over $14 million in bids to secure over 357,500 acres in federal waters. BOEM expects to hold another lease auction for sites offshore New Jersey in 2015.
US energy consumers paid $14 billion more last winter
Tuesday, May 27, 2014
U.S. consumers paid $14 billion more for their energy needs during the winter of 2013-2014 compared to the previous winter, according to a report by the U.S. Energy Information Administration.
The cost of energy affects people and businesses across the country. Consumers are affected by both the price they pay per unit of electricity or fuel for transportation and heating and the volume of each energy commodity they demand. In much of the U.S., demand for energy increases during winter months. The winter season often sees prices increase as well, as more expensive supply is needed to meet consumer demand.
The winter of 2013-2014 was no exception, according to the EIA's data. U.S. consumers spent $14 billion more for energy during the fourth quarter of 2013 and first quarter of 2014 compared to the previous winter. This amounts to an increase of 4.4%, or a 0.1% increase when measured as a share of disposable income.
The biggest drivers of the increase in consumer energy costs were higher expenditures for electricity, natural gas, heating oil and propane. Electricity expenditures increased $7.9 billion, or 10%, last winter compared with the previous winter. Much of the increased cost of electricity came as a result of increased costs for natural gas, a key fuel used for electric power generation. Constraints on interstate natural gas pipelines drive fuel prices up as demand increases. Throughout much of the northeast region, interstate natural gas pipelines reach their maximum flow rates on an increasing number of winter days. When the pipelines begin to fill, the price of natural gas delivered into the constrained region increases. Ultimately, when the pipelines have reached their maximum capacity, no more natural gas can be bought at any price.
The price of natural gas also affects consumers directly, as consumers also rely upon natural gas for space heating and applications like drying. EIA's data show that consumer expenditures for natural gas increased by $5.8 billion, or 16%, last winter compared with the previous winter.
Expenditures for the other major heating fuels -- oil and propane -- also increased by $6.0 billion, or 27%, over the previous winter. As EIA notes, heating oil and propane are used predominantly for space heating and are used to heat a relatively small number of homes, but their use is concentrated in the Northeast -- the area of the country that experienced the coldest weather this winter. Propane consumers experienced not only price spikes but even shortages during the coldest parts of the season.
As costly as the past winter was, the increase in consumer energy costs would have been even higher if transportation-related costs had not decreased significantly. In fact, transportation accounts for the largest single share of U.S. consumers' energy budget -- often over two-thirds of energy expenditures during the summer driving season, and over half of energy expenditures even in the winter. But transportation fuel expenses decreased by $5.8 billion, or 3%, last winter compared with the previous winter. EIA cites reductions in demand for gasoline due to winter storms that reduced driving.
Weather is a significant factor affecting winter energy costs -- but policies and infrastructure also play major roles in shaping consumers' energy expenditures. What will next winter bring?
The cost of energy affects people and businesses across the country. Consumers are affected by both the price they pay per unit of electricity or fuel for transportation and heating and the volume of each energy commodity they demand. In much of the U.S., demand for energy increases during winter months. The winter season often sees prices increase as well, as more expensive supply is needed to meet consumer demand.
The winter of 2013-2014 was no exception, according to the EIA's data. U.S. consumers spent $14 billion more for energy during the fourth quarter of 2013 and first quarter of 2014 compared to the previous winter. This amounts to an increase of 4.4%, or a 0.1% increase when measured as a share of disposable income.
The biggest drivers of the increase in consumer energy costs were higher expenditures for electricity, natural gas, heating oil and propane. Electricity expenditures increased $7.9 billion, or 10%, last winter compared with the previous winter. Much of the increased cost of electricity came as a result of increased costs for natural gas, a key fuel used for electric power generation. Constraints on interstate natural gas pipelines drive fuel prices up as demand increases. Throughout much of the northeast region, interstate natural gas pipelines reach their maximum flow rates on an increasing number of winter days. When the pipelines begin to fill, the price of natural gas delivered into the constrained region increases. Ultimately, when the pipelines have reached their maximum capacity, no more natural gas can be bought at any price.
The price of natural gas also affects consumers directly, as consumers also rely upon natural gas for space heating and applications like drying. EIA's data show that consumer expenditures for natural gas increased by $5.8 billion, or 16%, last winter compared with the previous winter.
Expenditures for the other major heating fuels -- oil and propane -- also increased by $6.0 billion, or 27%, over the previous winter. As EIA notes, heating oil and propane are used predominantly for space heating and are used to heat a relatively small number of homes, but their use is concentrated in the Northeast -- the area of the country that experienced the coldest weather this winter. Propane consumers experienced not only price spikes but even shortages during the coldest parts of the season.
As costly as the past winter was, the increase in consumer energy costs would have been even higher if transportation-related costs had not decreased significantly. In fact, transportation accounts for the largest single share of U.S. consumers' energy budget -- often over two-thirds of energy expenditures during the summer driving season, and over half of energy expenditures even in the winter. But transportation fuel expenses decreased by $5.8 billion, or 3%, last winter compared with the previous winter. EIA cites reductions in demand for gasoline due to winter storms that reduced driving.
Weather is a significant factor affecting winter energy costs -- but policies and infrastructure also play major roles in shaping consumers' energy expenditures. What will next winter bring?
EIA releases 2014 Annual Energy Outlook
Wednesday, May 14, 2014
The U.S. Energy Information Administration has released its annual report projecting long-term trends in energy markets.
The Energy Information Administration, or EIA, is the statistical and analytical agency within the U.S. Department of Energy. Its 2014 Annual Energy Outlook (269-page PDF) presents long-term annual projections of energy supply, demand, and prices focused on the U.S. through 2040. Based on data-driven models, the report considers a reference case under which it assumes current laws and regulations remain unchanged, as well as alternative cases that explore important areas of uncertainty for markets, technologies, and policies in the U.S. energy economy.
The report's biggest findings include projections that:
How will EIA's projections fare over the coming years?
The Energy Information Administration, or EIA, is the statistical and analytical agency within the U.S. Department of Energy. Its 2014 Annual Energy Outlook (269-page PDF) presents long-term annual projections of energy supply, demand, and prices focused on the U.S. through 2040. Based on data-driven models, the report considers a reference case under which it assumes current laws and regulations remain unchanged, as well as alternative cases that explore important areas of uncertainty for markets, technologies, and policies in the U.S. energy economy.
The report's biggest findings include projections that:
- Growing domestic production of natural gas and oil continues to reshape the U.S. energy economy, largely as a result of rising production from tight formations, but the effect could vary substantially depending on expectations about resources and technology.
- Industrial production expands over the next 10 to 15 years as the competitive advantage of low natural gas prices provides a boost to the industrial sector with increasing natural gas use.
- There is greater upside uncertainty than downside uncertainty in oil and natural gas production; higher production could spur even more industrial growth and lower the use of imported petroleum.
- Improvement in light-duty vehicle (LDV) efficiency more than offsets modest growth in vehicle miles traveled (VMT) that reflects changing driving patterns, leading to a sharp decline in LDV energy use.
- Evolving natural gas markets spur increased use of natural gas for electricity generation and transportation, as well as expanded export opportunities.
- Improved efficiency of energy use in the residential and transportation sectors and a shift away from more carbon-intensive fuels such as coal for electricity generation help to stabilize U.S. energy-related carbon dioxide (CO2) emissions.
How will EIA's projections fare over the coming years?
Predictions for renewable energy in 2013
Tuesday, October 8, 2013
With under three months left in 2013, we will soon learn whether this year's projections for the energy industry prove accurate. The U.S. Energy Information Administration publishes a series of short-term energy outlook reports covering crude oil and liquid fuels, natural gas, coal, and electricity. What has EIA forecast for the year in renewable energy?
EIA projects a continued increase in the consumption of renewable energy in the forms of electricity and heat generation. Overall, in 2013 EIA expects 4.5% growth over 2012's renewable energy consumption, with further growth of 2.3% in 2014.
EIA also predicts shifts in the resource mix providing this renewable energy. In 2013, EIA expects a 1.5% decline in hydropower production, offset by 8.3% average growth of nonhydropower renewables used for electricity and heat generation. In particular, EIA expects 2.5% growth in wind capacity this year, reaching a total installed capacity of about 61 gigawatts from wind. This capacity is predicted to enable generation from wind to increase 19% in 2013 and another 2.4% in 2014, at which point it is expected to reach over 4% of all electricity generated in the U.S.
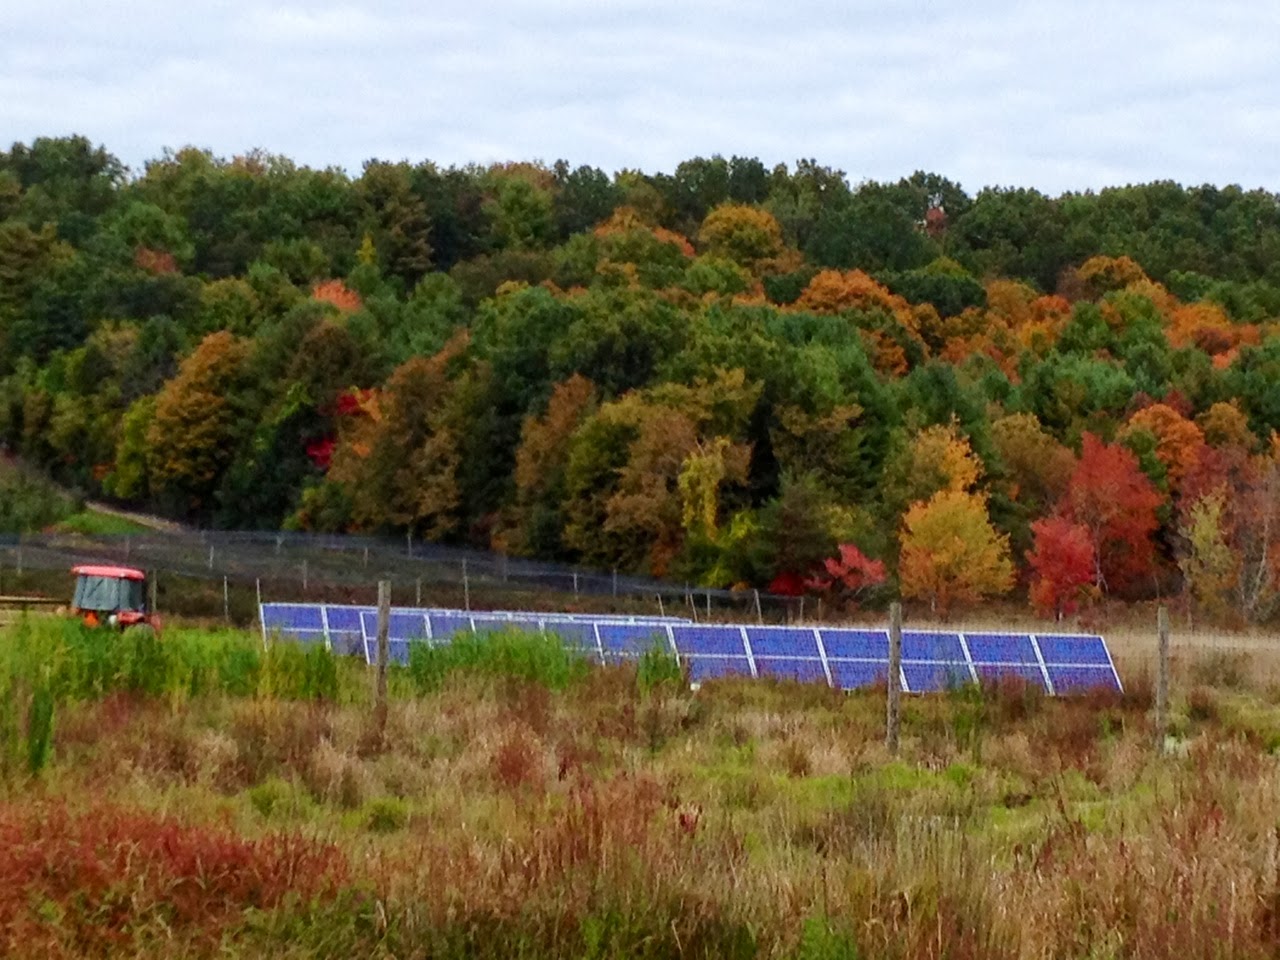
Solar energy is expected to grow more sharply, but will remain a relatively small segment of the nation's overall energy portfolio. EIA expects solar generation by the electric power sector to increase a staggering 79% in 2013 and 80% in 2014. In recent years, customer-sited distributed generation projects have led the charge in new capacity additions, but EIA expects utility-scale projects to more than double in total installed capacity between 2012 and 2014. Most of this new utility-scale solar capacity will continue to come from photovoltaics, but several large solar thermal generation projects may come online the next two years. Despite this relative growth, the small absolute size of the U.S. solar market means that solar energy will only account for about 0.3% of energy consumed in 2014.
When 2013 has ended, will EIA's predictions come true? We will learn in several months.
 |
| Fall foliage and solar photovoltaic panels at Cider Hill Farm in Amesbury, Massachusetts. |
EIA projects a continued increase in the consumption of renewable energy in the forms of electricity and heat generation. Overall, in 2013 EIA expects 4.5% growth over 2012's renewable energy consumption, with further growth of 2.3% in 2014.
EIA also predicts shifts in the resource mix providing this renewable energy. In 2013, EIA expects a 1.5% decline in hydropower production, offset by 8.3% average growth of nonhydropower renewables used for electricity and heat generation. In particular, EIA expects 2.5% growth in wind capacity this year, reaching a total installed capacity of about 61 gigawatts from wind. This capacity is predicted to enable generation from wind to increase 19% in 2013 and another 2.4% in 2014, at which point it is expected to reach over 4% of all electricity generated in the U.S.
Solar energy is expected to grow more sharply, but will remain a relatively small segment of the nation's overall energy portfolio. EIA expects solar generation by the electric power sector to increase a staggering 79% in 2013 and 80% in 2014. In recent years, customer-sited distributed generation projects have led the charge in new capacity additions, but EIA expects utility-scale projects to more than double in total installed capacity between 2012 and 2014. Most of this new utility-scale solar capacity will continue to come from photovoltaics, but several large solar thermal generation projects may come online the next two years. Despite this relative growth, the small absolute size of the U.S. solar market means that solar energy will only account for about 0.3% of energy consumed in 2014.
When 2013 has ended, will EIA's predictions come true? We will learn in several months.
Maine standard offer prices jump up 23%
Thursday, July 25, 2013
The upward trend in wholesale natural gas and electricity prices in New England will begin to hit retail consumers later this summer, based on the bids accepted today by the Maine Public Utilities Commission for standard offer electricity service.
Following Maine’s deregulation of the electric power industry, transmission and distribution utilities no longer sell electricity but merely provide wires enabling the delivery of power. For their energy needs, customers may choose among licensed competitive electricity providers, or may receive so-called “standard offer service” by default. Most residential consumers receive standard offer service, while more than half of the load of medium and large commercial and industrial customers is served by customer-selected competitive providers.
The providers of standard offer service, and the prices customers pay for standard offer service, are selected by the Maine Public Utilities Commission through a competitive process. In deliberations this afternoon, the Commission established new prices for standard offer electricity supply service for medium commercial and industrial customers of Maine’s two largest utilities, Central Maine Power Co. and Bangor Hydro Electric Co. Over a six-month term starting on September 1, 2013, Central Maine Power’s medium commercial and industrial customers taking standard offer service will pay an average price of 7.5 cents/kWh. Bangor Hydro customers will pay 7.45 cents/kWh. These new prices are over 23% higher than current standard offer prices for these customers, and are between 17% and 19% higher compared to last year’s standard offer pricing.
Why have these prices gone up? One explanation is that suppliers are pricing the recent upward trend in regional wholesale natural gas and electricity prices into their retail bids. Wholesale electricity pricing in New England is generally set by the price of natural gas. Despite the availability of low-cost natural gas throughout most of the country, peak demands for natural gas in New England for heating and for electric power generation exceed the capability of the natural gas pipeline network to deliver gas into the region. As a result, the wholesale price of natural gas – and electricity – spikes as demand for gas increases. Based on last winter's experience with this phenomenon, retail electricity suppliers are expecting similar high wholesale prices this winter, and are increasing their retail rate bids accordingly.
One solution that could keep downward pressure on the cost of natural gas and electricity is expanded pipeline infrastructure to enable a balance between supply and demand for natural gas deliveries into New England. New England states are working to promote this solution, which could save consumers over $1 billion per year. Until then, the likelihood is for continued upward pressure on wholesale electricity prices, and corresponding upward jumps in the retail price consumers pay for electricity as evidenced by the new standard offer prices.
Following Maine’s deregulation of the electric power industry, transmission and distribution utilities no longer sell electricity but merely provide wires enabling the delivery of power. For their energy needs, customers may choose among licensed competitive electricity providers, or may receive so-called “standard offer service” by default. Most residential consumers receive standard offer service, while more than half of the load of medium and large commercial and industrial customers is served by customer-selected competitive providers.
The providers of standard offer service, and the prices customers pay for standard offer service, are selected by the Maine Public Utilities Commission through a competitive process. In deliberations this afternoon, the Commission established new prices for standard offer electricity supply service for medium commercial and industrial customers of Maine’s two largest utilities, Central Maine Power Co. and Bangor Hydro Electric Co. Over a six-month term starting on September 1, 2013, Central Maine Power’s medium commercial and industrial customers taking standard offer service will pay an average price of 7.5 cents/kWh. Bangor Hydro customers will pay 7.45 cents/kWh. These new prices are over 23% higher than current standard offer prices for these customers, and are between 17% and 19% higher compared to last year’s standard offer pricing.
Why have these prices gone up? One explanation is that suppliers are pricing the recent upward trend in regional wholesale natural gas and electricity prices into their retail bids. Wholesale electricity pricing in New England is generally set by the price of natural gas. Despite the availability of low-cost natural gas throughout most of the country, peak demands for natural gas in New England for heating and for electric power generation exceed the capability of the natural gas pipeline network to deliver gas into the region. As a result, the wholesale price of natural gas – and electricity – spikes as demand for gas increases. Based on last winter's experience with this phenomenon, retail electricity suppliers are expecting similar high wholesale prices this winter, and are increasing their retail rate bids accordingly.
One solution that could keep downward pressure on the cost of natural gas and electricity is expanded pipeline infrastructure to enable a balance between supply and demand for natural gas deliveries into New England. New England states are working to promote this solution, which could save consumers over $1 billion per year. Until then, the likelihood is for continued upward pressure on wholesale electricity prices, and corresponding upward jumps in the retail price consumers pay for electricity as evidenced by the new standard offer prices.
FERC reports on 2012 electricity, natural gas markets
Tuesday, July 9, 2013
The Federal Energy Regulatory Commission has released its 2012 State of the Markets Report. The 77-page document reviews developments and trends in U.S. electricity and natural gas markets. Trends highlighted in this year's report include the replacement of coal for electric power generation with natural gas, decreased prices for natural gas and electricity, and reduced demand for electricity.
The report's findings include:
The report's findings include:
- Record natural gas pricing led to lower natural gas prices. In 2012, driven by the increase in shale gas production, domestic production of natural gas reached a new record. As a result, natural gas prices reached 10-year lows throughout most the nation. For example, the spot price at Louisiana’s Henry Hub averaged $2.74/MMBtu for 2012, a 31 percent decrease from 2011.
- Electric generators relied on natural gas instead of coal. As a result of the low natural gas prices, combined with tighter environmental regulations, natural gas's share of electricity production rose to 31 percent in 2012. Meanwhile coal-fired power generation fell to its lowest level in 30 years -- just 39 percent of total generation.
- Electricity demand fell. The nation consumed 1.7 percent less electricity in 2012 than 2011. This reduction amounted to 62.9 TWh in 2012. The report attributes the decrease in demand to three primary factors: a decrease in residential demand, lack of demand growth in the commercial and industrial sectors, and increased energy efficiency.
- Electricity prices declined due to lower-cost natural gas and reduced demand. Because natural gas typically represents the marginal fuel in electric generation, reducing the price of natural gas usually reduces the wholesale price in electricity markets. Generally speaking, Eastern prices were between 1 percent and 31 percent lower than in 2011 while Western prices fell between 6 percent and 23 percent. Likewise, reductions in the demand for electricity due to a relatively warm winter, economic trends and increased energy efficiency contributed to lower electricity prices in 2012.
Feds release June 2013 short-term energy outlook
Thursday, June 13, 2013
The U.S. Energy Information Administration has released its updated short-term energy outlook. The report describes recent trends in fuel and energy resource markets, and predicts future supply, demand, and prices. Highlights from the June 2013 report include:
EIA's projections are based on a variety of assumptions about the domestic and global economies, energy project development, and weather-related demand for energy products. EIA's next short-term energy outlook will be released on July 9, 2013.
- Gasoline prices to decrease: EIA predicts that the price of regular gasoline will average $3.53 per gallon over the summer driving season. Noting a decrease from 2012's annual average retail price of $3.63 per gallon, EIA predicts that gasoline will continue to decline in price to $3.49 per gallon in 2013 and to $3.37 per gallon in 2014. That said, EIA notes significant uncertainty about this forecast based in part on current values of futures and options contracts.
- Crude oil prices to decrease: EIA predicts similar decreases in the price of crude oil through 2014. Through much of the world, oil commodity pricing is based on the Brent crude price -- the price paid for a sweet light crude oil produced from Europe's North Sea fields. Spot pricing for Brent crude bounced around in the first 5 months of 2012, ranging from a low of $97 per barrel in April to a high of $119 per barrel in February. EIA expects a slow decrease in the Brent crude oil spot price, averaging $102 per barrel over the second half of 2013, and $100 per barrel in 2014.
- Electricity usage to decrease while prices increase: EIA's forecasts call for milder temperatures than last summer, driving air conditioning-related demand for electricity downward. At the same time, EIA expects a 2% increase in average prices for delivered electricity this summer. Last year, the U.S. residential electricity price averaged 11.9 cents per kWh. EIA expects this summer's average price to rise to 12.3 cents/kWh, with a 1.1 percent price increase in 2013 and a 1.9 percent in 2014.
EIA's projections are based on a variety of assumptions about the domestic and global economies, energy project development, and weather-related demand for energy products. EIA's next short-term energy outlook will be released on July 9, 2013.
Subscribe to:
Posts (Atom)
