Energy-related carbon dioxide emissions in the U.S. are projected to decrease by 2.2 percent in 2019 relative to the previous year, according to the latest forecast by the U.S. Energy Information Administration.
EIA tracks energy-related carbon dioxide emissions from petroleum, natural gas, and coal. Petroleum made up nearly half of energy-related CO2 emissions in 2018, at 45 percent of all energy-related carbon dioxide emissions. Transportation, heating, and electric power generation sectors consume significant amounts of petroleum. EIA projects petroleum
CO2 emissions will remain relatively flat in 2019, relative to 2018.
According to EIA, nearly all of its forecast decrease for 2019 is due to reduced emissions from coal
consumption. EIA forecasts that coal-derived CO2 emissions will decrease by 169 million metric tons (MMmt) in
2019. This represents the largest year-over-year decrease in coal-derived CO2 emissions since 2015. Nearly all the coal used in the U.S. -- 92 percent -- is consumed by the electric power sector; EIA attributes the decline to forecast changes in the electricity generation mix, with coal plants retiring and relatively milder summer weather expected to lead to overall lower electricity demand.
While coal-related emissions are projected to decline, EIA projects that forecast natural gas CO2 emissions will increase by 53 MMmt, largely due to increased use of natural gas to displace coal for electric power generation. According to EIA, the decrease in coal emissions will more than outweigh the increase in natural gas emissions, because natural gas-fired
electricity generation is less carbon-intensive than coal-fired
electricity generation.

Energy powers society; society's choices shape energy policy. A blog about our energy resources and the choices they present for society.
Showing posts with label petroleum. Show all posts
Showing posts with label petroleum. Show all posts

U.S. to export more energy by 2020 than it imports, projects EIA
Tuesday, January 29, 2019
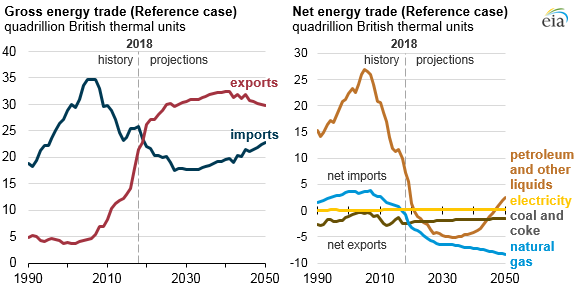
Federal energy analysts project that the United States will export more energy than it imports by 2020, making the nation a net energy exporter for the first time since the 1950s. Fossil fuels represent the largest volumes of this international trade.
The United States both exports and imports energy in a variety of forms, including natural gas, coal and coke, petroleum and other liquids, and electricity. According to the U.S. Energy Information Administration, the United States has long been a net exporter of coal and coke. In 2017, the nation began exporting more natural gas than it imports, primarily in the form of liquified natural gas or LNG. EIA notes that electricity trades with neighboring Canada and Mexico represent "a relatively small part of U.S. net energy trade flows."
The EIA projects that domestic production of crude oil, natural gas, and natural gas plant liquids will continue to grow at a faster rate than U.S. energy consumption over the next decade, meaning the balance of these fuels will be exported. EIA projects that due to "evolving trade flows of liquid fuels and natural gas," increasing exports of these fuels will tip the trade balance to where the U.S. is a net exporter of energy by 2020. When this shift occurs, it will represent the first time that the United States exports more energy than it imports on an annual basis since 1953.
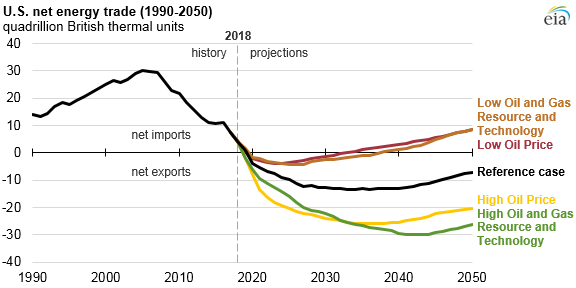
Exactly how large the nation's net exports might be -- and how long the net-exporter status might last -- depend on a variety of assumptions about matters including oil and gas prices, resource extraction technologies, and possible changes to law. Under EIA's reference case which reflects current laws and regulations, the U.S. begins exporting more energy than it imports on an annual basis in 2020 and maintains that status through 2050. In other cases featuring lower prices or extraction rates for oil and gas, EIA projects that U.S. will return to net-importer status by the mid- to late-2030s.
Changes to laws and regulations could also affect the trade balance for energy products.
 |
| Source: U.S. Energy Information Administration |
The EIA projects that domestic production of crude oil, natural gas, and natural gas plant liquids will continue to grow at a faster rate than U.S. energy consumption over the next decade, meaning the balance of these fuels will be exported. EIA projects that due to "evolving trade flows of liquid fuels and natural gas," increasing exports of these fuels will tip the trade balance to where the U.S. is a net exporter of energy by 2020. When this shift occurs, it will represent the first time that the United States exports more energy than it imports on an annual basis since 1953.
Exactly how large the nation's net exports might be -- and how long the net-exporter status might last -- depend on a variety of assumptions about matters including oil and gas prices, resource extraction technologies, and possible changes to law. Under EIA's reference case which reflects current laws and regulations, the U.S. begins exporting more energy than it imports on an annual basis in 2020 and maintains that status through 2050. In other cases featuring lower prices or extraction rates for oil and gas, EIA projects that U.S. will return to net-importer status by the mid- to late-2030s.
 |
| Source: U.S. Energy Information Administration |
Senate climate bill proposes carbon fee
Monday, March 11, 2013
Senators Barbara Boxer of California and Bernie Sanders of Vermont have introduced climate legislation that would impose a fee of $20 per ton of carbon or methane equivalent emitted. The Climate Protection Act of 2013 provides measures designed to "address climate disruptions, reduce carbon pollution, enhance the use of clean energy, and promote resilience in the infrastructure of the United States". What does the Senate climate bill do -- and what are its chances of passage?
The centerpiece of the Climate Protection Act of 2013 is a fee imposed by the Administrator of the U.S. Environmental Protection Agency on carbon emissions. Starting in 2014, the carbon pollution fee would be $20 per ton of carbon dioxide or equivalent. For the next 10 years, the fee would increase by 5.6 percent per year, after which it would hold steady at about $34 per ton.
The fee would apply to any manufacturer, producer, or importer of a carbon polluting substance, defined as coal (including lignite and peat), petroleum and any petroleum product, or natural gas that releases greenhouse gas emissions when combusted or used. The fee would apply whether the carbon polluting substance is produced in the U.S. or is imported. As designed, it would be an "upstream" fee, meaning only the first producer or importer of the substance would have to pay the fee directly; subsequent users would not be liable for the fee, although they would likely pay a higher price to acquire the fuel as the the upstream entity passes its costs along.
60% of the funds raised from the carbon pollution fee would be used to provide a monthly residential environmental rebate to legal residents of the United States. The remainder would be used to create a Pollution Reduction Trust Fund. The Trust Fund would be divided up for five purposes. $7.5 billion per year would go to the EPA to mitigate the economic impacts of the carbon pollution fee on energy-intensive and trade-exposed industries. $5 billion shall be available to the Department of Energy to carry out a Weatherization Assistance Program for Low-Income Persons. $1 billion would go to the Secretary of Labor for job training, education, and transition assistance for individuals employed by the fossil fuel industry. $2 billion will go to the Advanced Research Projects Agency-Energy program. The balance shall be used shall be used for federal budget deficit reduction, as would the entire Trust Fund after 2024.
To protect domestic industry against competitive harms caused by the carbon pollution fee, the Climate Protection Act of 2013 also includes a carbon equivalency fee on imports of carbon pollution-intensive goods. Those goods would include iron, steel, a steel mill product (including pipe and tube), aluminum, cement, glass (including flat, container, and specialty glass and fiberglass), pulp, paper, a chemical, or an industrial ceramic, as well as any other goods whose production is deemed to have similar carbon intensity.
Funds raised the carbon equivalency fee would be split between the EPA and the Department of Transportation. The EPA would use its share primarily to fund state and local programs that assist communities in adapting to climate change, improving the resiliency of critical infrastructure; and protecting environmental quality and wildlife. EPA could also use the funds to meet international commitments made by the United States to assist with climate change adaptation. The Department of Transportation's share would be used to fund state and local programs that assist communities in improving the resiliency of critical infrastructure and for projects that provide preferential parking for carpools, including the addition of electric vehicle charging stations.
Will the Climate Protection Act of 2013 pass? Congress has previously considered several structures to encourage a shift to lower-carbon energy resources, ranging from creating a national cap-and-trade market to a carbon tax. To date, none has passed, although individual states and regions have created cap-and-trade programs like the Regional Greenhouse Gas Initiative (RGGI) and the California Air Resources Board market. President Obama called on Congress to address climate change and carbon emissions in his 2013 State of the Union address, and other jurisdictions such as the Canadian province of British Columbia have enacted a carbon tax. Could the carbon fee and dividend structure proposed in the Climate Protection Act of 2013 be the solution? At the least, it will provoke a national dialogue about carbon emissions and the federal government's role in managing them.
The centerpiece of the Climate Protection Act of 2013 is a fee imposed by the Administrator of the U.S. Environmental Protection Agency on carbon emissions. Starting in 2014, the carbon pollution fee would be $20 per ton of carbon dioxide or equivalent. For the next 10 years, the fee would increase by 5.6 percent per year, after which it would hold steady at about $34 per ton.
The fee would apply to any manufacturer, producer, or importer of a carbon polluting substance, defined as coal (including lignite and peat), petroleum and any petroleum product, or natural gas that releases greenhouse gas emissions when combusted or used. The fee would apply whether the carbon polluting substance is produced in the U.S. or is imported. As designed, it would be an "upstream" fee, meaning only the first producer or importer of the substance would have to pay the fee directly; subsequent users would not be liable for the fee, although they would likely pay a higher price to acquire the fuel as the the upstream entity passes its costs along.
60% of the funds raised from the carbon pollution fee would be used to provide a monthly residential environmental rebate to legal residents of the United States. The remainder would be used to create a Pollution Reduction Trust Fund. The Trust Fund would be divided up for five purposes. $7.5 billion per year would go to the EPA to mitigate the economic impacts of the carbon pollution fee on energy-intensive and trade-exposed industries. $5 billion shall be available to the Department of Energy to carry out a Weatherization Assistance Program for Low-Income Persons. $1 billion would go to the Secretary of Labor for job training, education, and transition assistance for individuals employed by the fossil fuel industry. $2 billion will go to the Advanced Research Projects Agency-Energy program. The balance shall be used shall be used for federal budget deficit reduction, as would the entire Trust Fund after 2024.
To protect domestic industry against competitive harms caused by the carbon pollution fee, the Climate Protection Act of 2013 also includes a carbon equivalency fee on imports of carbon pollution-intensive goods. Those goods would include iron, steel, a steel mill product (including pipe and tube), aluminum, cement, glass (including flat, container, and specialty glass and fiberglass), pulp, paper, a chemical, or an industrial ceramic, as well as any other goods whose production is deemed to have similar carbon intensity.
Funds raised the carbon equivalency fee would be split between the EPA and the Department of Transportation. The EPA would use its share primarily to fund state and local programs that assist communities in adapting to climate change, improving the resiliency of critical infrastructure; and protecting environmental quality and wildlife. EPA could also use the funds to meet international commitments made by the United States to assist with climate change adaptation. The Department of Transportation's share would be used to fund state and local programs that assist communities in improving the resiliency of critical infrastructure and for projects that provide preferential parking for carpools, including the addition of electric vehicle charging stations.
Will the Climate Protection Act of 2013 pass? Congress has previously considered several structures to encourage a shift to lower-carbon energy resources, ranging from creating a national cap-and-trade market to a carbon tax. To date, none has passed, although individual states and regions have created cap-and-trade programs like the Regional Greenhouse Gas Initiative (RGGI) and the California Air Resources Board market. President Obama called on Congress to address climate change and carbon emissions in his 2013 State of the Union address, and other jurisdictions such as the Canadian province of British Columbia have enacted a carbon tax. Could the carbon fee and dividend structure proposed in the Climate Protection Act of 2013 be the solution? At the least, it will provoke a national dialogue about carbon emissions and the federal government's role in managing them.
Flow chart of 2011 US energy use
Tuesday, November 13, 2012
A flow chart released by the Lawrence Livermore National Laboratory illustrates the sources and uses of energy in the United States. It depicts information about all the energy sources used to power society, as well as the breakdown of how that energy is used - or wasted - in electricity generation, transportation, residential, commercial, and industrial contexts.
 On the energy source side, petroleum - oil, gasoline, and similar products - provides the largest share of the energy we consume, slightly more than a third of total energy. Natural gas comes in second, providing about a quarter of total energy, with coal coming in at another 20%. Altogether, these fossil fuels provided about 82% of the energy consumed in the U.S. in 2011. Nuclear power provided about 8% of the energy used. The remainder came from renewable resources including biomass, hydropower, wind, geothermal, and solar.
About 40% of the energy from these sources was used to generate electricity. The remainder was used directly for other purposes such as transportation, heating, and industrial processes.
On the use side, transportation consumed the largest share of energy, about 28%. The industrial sector consumed another 24% of the energy. Households consumed about 11%, and commercial businesses consumed about 9%.
This analysis of energy use leaves about 27% of the energy unaccounted for. This energy was consumed in the generation of electricity, but was "rejected", meaning that it could not be captured for a useful purpose. Waste heat being emitted from a generator is a classic example of this rejected energy. End users from industry to residences also waste or reject energy; in fact, according to the chart, 57% of the total energy consumed in the U.S. in 2011 was rejected, while only 43% was put to a useful purpose.
About 40% of the energy from these sources was used to generate electricity. The remainder was used directly for other purposes such as transportation, heating, and industrial processes.
On the use side, transportation consumed the largest share of energy, about 28%. The industrial sector consumed another 24% of the energy. Households consumed about 11%, and commercial businesses consumed about 9%.
This analysis of energy use leaves about 27% of the energy unaccounted for. This energy was consumed in the generation of electricity, but was "rejected", meaning that it could not be captured for a useful purpose. Waste heat being emitted from a generator is a classic example of this rejected energy. End users from industry to residences also waste or reject energy; in fact, according to the chart, 57% of the total energy consumed in the U.S. in 2011 was rejected, while only 43% was put to a useful purpose.
Subscribe to:
Posts (Atom)
