Showing posts with label economy. Show all posts

EIA says 2016 U.S. energy expenditures declined to lowest share of GDP since 1970

Thursday, January 24, 2019

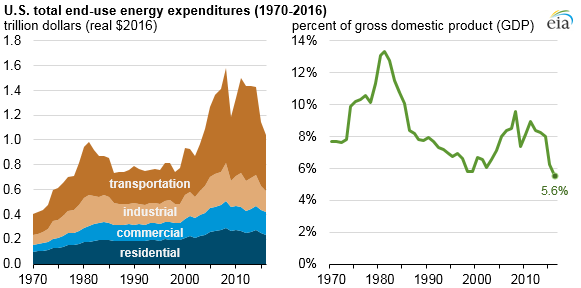
According to the most recent data released by the U.S. Energy Information Administration, in 2016, U.S. energy expenditures declined for the fifth consecutive year, reaching $1.0 trillion in 2016. This represents a 9% decrease in real terms from 2015.

Adjusted for inflation, total energy expenditures in 2016 were the lowest since 2003. Expressed as a percent of gross domestic product (GDP), total energy expenditures were 5.6% in 2016, the lowest share of GDP since at least 1970. According to EIA, contributing factors include steady annual increases in GDP since 2010, coupled with steady annual decreases in total energy expenditures since 2011.

Source: EIA, "In 2016, U.S. energy expenditures per unit GDP were the lowest since at least 1970"

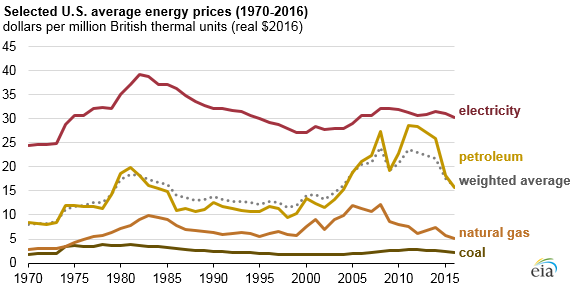
Meanwhile, annual total U.S. energy consumption has remained virtually flat since 2013. So the recent decreases in total energy expenditures are generally the result of lower energy prices. But EIA says it doesn’t expect this trend to continue, as average energy prices of products such as motor gasoline, natural gas, and retail electricity have all increased since 2016.

Source: EIA, "In 2016, U.S. energy expenditures per unit GDP were the lowest since at least 1970"
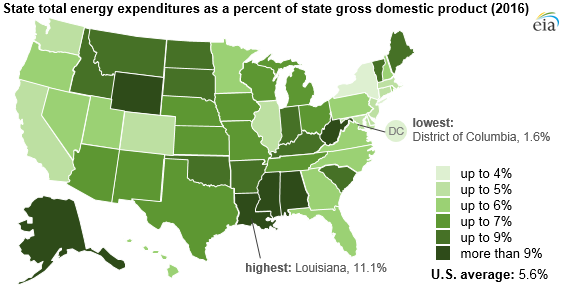
EIA also notes significant geographic variation in state total energy expenditures as a percent of state GDP. In 2016, Louisiana led the pack as it has every year since EIA started tracking this metric in 1997, with 2016 energy expenditures per GDP of 11.1% in 2016. EIA points to Louisiana’s large industrial sector consumption, including its energy-intensive petrochemical industry, as the biggest piece of the explanation.

Source: EIA, "In 2016, U.S. energy expenditures per unit GDP were the lowest since at least 1970"

But even while leading the nation, Louisiana set its own record-low ratio of energy expenditures per GDP, at a level that was less than half of the state’s previous high (26.5%) which was reached in 2008. Meanwhile, District of Columbia (1.6%), New York (3.3%), Massachusetts (4.3%), California (4.3%), and Delaware (4.4%) had the lowest energy expenditures per GDP in 2016. EIA says this reflects relatively high consumption in less energy-intensive residential and commercial sectors as well as relatively high state GDP.

Energy and State of the Union 2015

Thursday, January 22, 2015

President Obama delivered his 2015 State of the Union address on January 20, 2015.  In his remarks as prepared for delivery, he addressed energy-related themes including the growth of U.S. energy resource production and climate change.

As in his 2013 and 2014 addresses, increased domestic production of energy resources featured prominently in the 2015 State of the Union speech, for its economic, political, and national security benefits:
At this moment – with a growing economy, shrinking deficits, bustling industry, and booming energy production – we have risen from recession freer to write our own future than any other nation on Earth.  It’s now up to us to choose who we want to be over the next fifteen years, and for decades to come...
We believed we could reduce our dependence on foreign oil and protect our planet.  And today, America is number one in oil and gas.  America is number one in wind power.  Every three weeks, we bring online as much solar power as we did in all of 2008.  And thanks to lower gas prices and higher fuel standards, the typical family this year should save $750 at the pump.
During the past several years, U.S. production of oil and natural gas has increased significantly.  According to the U.S. Energy Information Administration, total U.S. crude oil production averaged an estimated 9.2 million barrels per day (bbl/d) in December 2014, and forecasts for oil productino continue to grow.  EIA predicts that projected crude oil production will reach 9.5 million bbl/d in 2016, constituting the second-highest annual average level of production in U.S. history (after 9.6 million bbl/d in 1970.)

EIA also predicts continued growth in the use of renewable energy resources to produce electricity and heat. In 2014, 6.4% of electric generation came from hydropower and 6.7% from nonhydropower renewables. EIA projects continued growth of nonhydropower renewables, reaching an electricity generation share of 7.9% by 2016.  Wind is the largest source of nonhydropower renewable generation, and it is projected to contribute 5.3% of total electricity generation in 2016.

President Obama also addressed climate change in this year's State of the Union address, and his administration's efforts to combat and mitigate its effects:
2014 was the planet’s warmest year on record.  Now, one year doesn’t make a trend, but this does – 14 of the 15 warmest years on record have all fallen in the first 15 years of this century. 
I’ve heard some folks try to dodge the evidence by saying they’re not scientists; that we don’t have enough information to act.  Well, I’m not a scientist, either.  But you know what – I know a lot of really good scientists at NASA, and NOAA, and at our major universities.  The best scientists in the world are all telling us that our activities are changing the climate, and if we do not act forcefully, we’ll continue to see rising oceans, longer, hotter heat waves, dangerous droughts and floods, and massive disruptions that can trigger greater migration, conflict, and hunger around the globe.  The Pentagon says that climate change poses immediate risks to our national security.  We should act like it.
That’s why, over the past six years, we’ve done more than ever before to combat climate change, from the way we produce energy, to the way we use it.  That’s why we’ve set aside more public lands and waters than any administration in history.  And that’s why I will not let this Congress endanger the health of our children by turning back the clock on our efforts.  I am determined to make sure American leadership drives international action.  In Beijing, we made an historic announcement – the United States will double the pace at which we cut carbon pollution, and China committed, for the first time, to limiting their emissions.  And because the world’s two largest economies came together, other nations are now stepping up, and offering hope that, this year, the world will finally reach an agreement to protect the one planet we’ve got.
His 2015 remarks on climate change reflect a belief or fear that Congress will not act on the issue, or will act to frustrate the Obama administration's efforts on climate change.  In 2013, President Obama asked Congress to develop a market-based solution to climate change, but said he would take executive action if Congress failed to act.  In 2014, he noted Congress's apparent unwillingness to act, and highlighted his administration's proposed new standards on power plant emissions of carbon.  This year's remarks continue the trend of featuring executive-branch solutions, and downplaying the likelihood of near-term legislative support.

Will U.S. production of energy continue to grow?  What economic, political, and national security impacts will flow from the shifts in and growth of the U.S. energy sector?  Will the U.S. continue to act -- or take more serious action -- on climate change?  The remainder of 2015 -- and of President Obama's term in office, which runs into January 2017 -- will show how these themes evolve.

FERC reports on 2012 electricity, natural gas markets

Tuesday, July 9, 2013

The Federal Energy Regulatory Commission has released its 2012 State of the Markets Report.   The 77-page document reviews developments and trends in U.S. electricity and natural gas markets.  Trends highlighted in this year's report include the replacement of coal for electric power generation with natural gas, decreased prices for natural gas and electricity, and reduced demand for electricity.

The report's findings include:

  • Record natural gas pricing led to lower natural gas prices.  In 2012, driven by the increase in shale gas production, domestic production of natural gas reached a new record.  As a result, natural gas prices reached 10-year lows throughout most the nation.  For example, the spot price at Louisiana’s Henry Hub averaged $2.74/MMBtu for 2012, a 31 percent decrease from 2011.

  • Electric generators relied on natural gas instead of coal.  As a result of the low natural gas prices, combined with tighter environmental regulations, natural gas's share of electricity production rose to 31 percent in 2012.  Meanwhile coal-fired power generation fell to its lowest level in 30 years -- just 39 percent of total generation.

  • Electricity demand fell.  The nation consumed 1.7 percent less electricity in 2012 than 2011.  This reduction amounted to 62.9 TWh in 2012.  The report attributes the decrease in demand to three primary factors: a decrease in residential demand, lack of demand growth in the commercial and industrial sectors, and increased energy efficiency.

  • Electricity prices declined due to lower-cost natural gas and reduced demand.  Because natural gas typically represents the marginal fuel in electric generation, reducing the price of natural gas usually reduces the wholesale price in electricity markets.  Generally speaking, Eastern prices were between 1 percent and 31 percent lower than in 2011 while Western prices fell between 6 percent and 23 percent.  Likewise, reductions in the demand for electricity due to a relatively warm winter, economic trends and increased energy efficiency contributed to lower electricity prices in 2012.

Utilities plan over $51.1 billion in transmission development

Tuesday, March 5, 2013

Growth in renewable electricity production will drive significant upgrades to the U.S. electric transmission grid, according to a study released by the Edison Electric Institute.  EEI's seventh annual "Transmission Projects: At a Glance" identifies over 150 transmission projects planned by EEI member utilities for development over the next decade.  According to the report, these projects entail investments of at least $51.1 billion through 2023.  While the transmission projects may advance multiple goals, the majority of the projected investments will be for projects supporting the integration of renewable resources into the grid.

EEI is a trade association composed of investor-owned electric utilities.  Its members represent approximately 70 percent of the U.S. electric power industry.  EEI tracks transmission investment by its members.  According to the report, annual transmission investment is increasing, from 11.1 billion in 2011 to approximately $15.1 billion in 2013.  At the same time, EEI has revised its total future projection downward.  In 2012, EEI members reported $64 billion in planned transmission over the next decade, but changing projections of system needs have revised that number downward to $51.1 billion.

Under federal laws including the Energy Policy Act of 2005, utilities are given incentives to develop transmission lines and related assets.  These incentives are designed to ensuring a safe and reliable electric grid, but also reward utilities for developing projects to integrate renewable resources like wind farms into the grid.  Because ratepayers ultimately bear the cost of transmission infrastructure, the Federal Energy Regulatory Commission and state public utilities commission regulate utility proposals to expand the grid. 

According to EEI, most proposed transmission projects advance multiple goals.  The study shows that 76% of projects (approximately $38.7 billion) are pitched as supporting the integration of renewable resources. In the aggregate, these projects entail the addition or upgrade of 13,300 miles of transmission lines.  Similarly, most projects are designed to enable electricity to flow across state lines; 52% ($26.5 billion) represent large interstate transmission projects spanning multiple states.

Whether each project identified in the EEI report will be built remains to be seen.  As demand for electricity shifts -- whether due to energy efficiency improvements, a declining economy, or newly proposed generating projects -- the need for any given transmission line may diminish.  For example, last year the $2 billion Potomac Appalachian Transmission Highline (PATH) project was canceled after it was deemed unnecessary.  The proposed Northern Pass transmission project connecting Quebec to New Hampshire is facing significant opposition due to the siting of its planned route, as well as on environmental and economic grounds.  Nevertheless, the significant transmission development projected by EEI remains likely to occur in the aggregate.

Corn, ethanol, drought, and demand

Thursday, July 12, 2012

Corn plays an important role in current United States transportation fuel policy - but environmental and economic factors are putting the pinch on corn ethanol producers.

The U.S. Renewable Fuel Standard program requires transportation fuel sold in the United States to contain at least a minimum volume of renewable fuel.  This renewable fuel is generally ethanol, produced by fermenting sugars contained in plant feedstocks like sugar cane and sugar beets, or sugars produced by converting plant-based starches like corn starch.  The program's goals include reducing greenhouse gas emissions from the transportation sector, reducing petroleum imports, and encouraging the development and expansion of the domestic renewable fuels sector.

In the U.S., more than 95 percent of operating ethanol plants reportedly use corn starch as their feedstock.  According to the U.S. Department of Agriculture, U.S. farmers planted 96.4 million acres of corn this year, the highest corn acreage since 1937.  Favorable field conditions this spring led to the quickest planting pace on record, with nearly all of the corn planted by May 20 and plants emerged by June 3.

This summer's high temperatures and widespread drought conditions - with nearly 56% of the area of the 48 contiguous states experiencing drought - have hurt the U.S. corn crop, resulting in reduced estimates for this year's crop.  This anticipated reduction is driving corn prices up, with the commodity trading at over $7 per bushel (contrast a 2007 U.S. Energy Information Administration analysis of transportation biofuels assuming corn prices of about $2 per bushel).  This price increase is cutting into ethanol producers' bottom line.

At the same time, transportation fuel consumers are driving less.  Between increased fleet efficiency prompted by both governmental mandates and a natural desire to cut costs, and the overall slowdown in the national economy, overall demand for ethanol fuel has not grown at the pace previously projected.

According to Reuters, the average ethanol plant operating in Illinois is currently losing 32 cents on every gallon it produces.  As a result, many ethanol plants are running below their production capacity, and several have announced planned closures.  EIA data shows that ethanol production dropped 4% last week to 821,000 barrels per day, the lowest production rate since July 23, 2010.

Proponents of blending ethanol into transportation fuels point to its nature as a renewable biofuel, lower cost than gasoline, and ability to be produced domestically.  Critics question the wisdom of converting a potential food crop into an energy commodity, as well as the economic and environmental consequences of current pro-ethanol policies.  Whatever the ultimate outcome, the climatic and economic conditions affecting the corn ethanol industry may be calling into question the sustainability of the current system.