Over 2 million light-duty EVs registered in the US in 2021

Wednesday, September 20, 2023

The number of light-duty electric vehicles registered in the U.S. reached 2.13 million in 2021, according to federal data. The Energy Information Administration reports a "sharp increase from the less than 100,000 EVs on the roads in 2012". The lagging nature of this data set and continued growth in EV adoption mean that an even greater number of EVs are now registered in the U.S.


EIA's annual EV registration data is segmented into two categories: battery-electric vehicles (without any internal combustion engine) and plug-in hybrid electric vehicles (with both batteries and a traditional engine). Both categories show strong growth since 2012, with BEV adoption growing even faster in 2021.

Consistent with the recent growth of EVs, the average EV registered in the U.S. was 3.6 years old in 2021, considerably younger than the 11.1-year-old age of the average non-EV. 

To explain the rise of EVs, EIA cites factors including changing consumer preferences and an increasing number of EV models, particularly in the "luxury" sector. EIA also notes the effect of government policies supporting beneficial electrification of the carbon-emission-intense transportation sector. Policies designed to increase EV uptake include purchase incentives like tax credits and rebates, zero-emission vehicle sales mandates, and fuel economy standards.

US added record amounts of small solar power in 2022

Tuesday, September 12, 2023

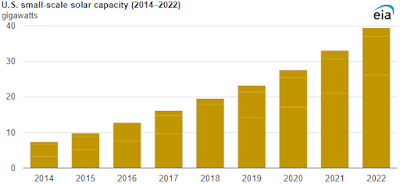
A recordbreaking amount of small-scale solar electric generating capacity was added to the U.S. grid in 2022, as the nation added more distributed solar than in any prior year according to federal energy data. 

The U.S. Energy Information Administration tracks the nation's portfolio of electric generation resources. EIA considers solar-power systems with one megawatt (MW) of capacity or less to be "small-scale solar", also called distributed solar or rooftop solar.

According to EIA, U.S. small-scale solar capacity has grown consistently year-over-year since the agency started tracking it in 2014. In the ensuing eight years, U.S. small-scale solar capacity grew from 7.3 gigawatts (GW) to reach 39.5 GW in 2022. 


About one-third of the total solar capacity in the U.S. now comes from small-scale systems. EIA reports that rooftop solar panels installed on homes make up the majority of the nation's small-scale solar capacity. Additional small-scale solar power systems are installed in commercial and industrial contexts.

EIA attributes growth in small-scale solar capacity over the past decade to tax credits and incentives, public policy, and higher retail electricity prices, as well as falling solar panel costs. The federal tax code includes tax credits for investments in small-scale solar power and other forms of clean energy. The scope and value of these credits was enhanced by the enactment of the Inflation Reduction Act. 

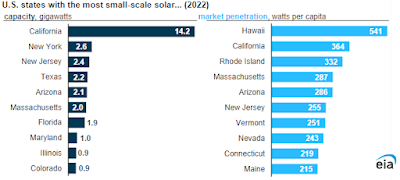
In addition, many states offer state-level incentives for solar power production. Diversity among state levels of solar adoption isn't just about how sunny a place might be, as EIA posits that the levels of state incentives affect the degree to which solar projects are developed in each state. 


EIA also notes that while many states with the most small-scale solar capacity also have large populations (like California and New York), some smaller states like Hawaii, Rhode Island, Maine, and Vermont have high levels of market penetration on a watts-per-capita basis.


Natural gas pricing drives New England's electricity costs

Friday, September 8, 2023

Two factors are the main drivers of wholesale electricity prices in New England, according to the region's grid operator: the cost of natural gas and other fuels used to generate electricity, and the level of consumer demand for power.

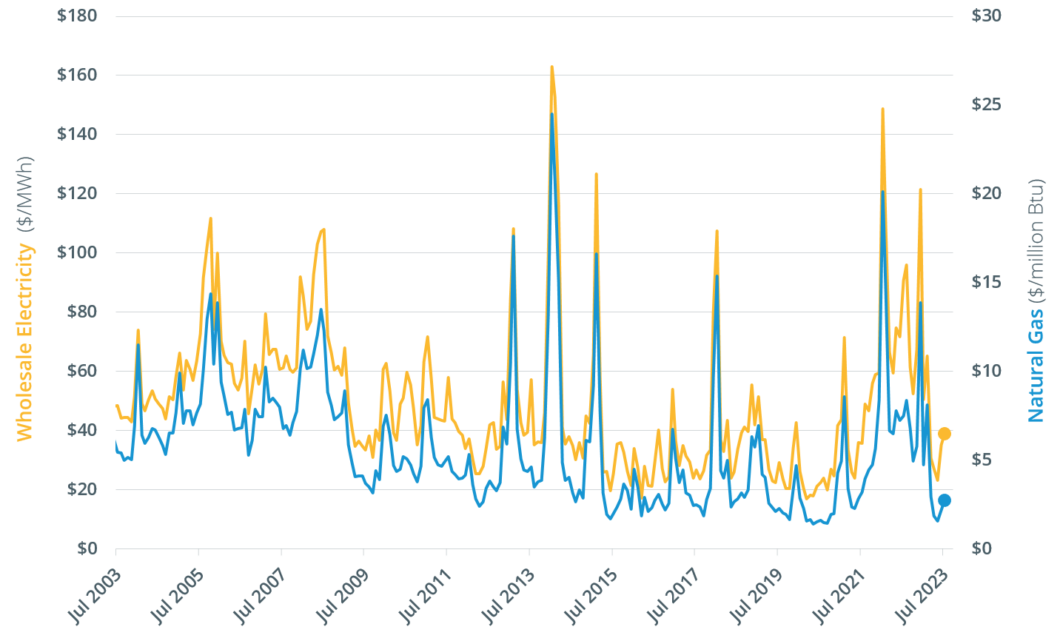
Fuel costs are a key component of the cost of electricity, and natural gas is the "predominant fuel in New England", used to generate 52% of the power produced in 2022 by New England’s power plants. According to ISO New England Inc., the regional transmission organization, natural gas-fired power plants usually set the price of wholesale electricity in New England.

As a result, the grid operator says that "average wholesale electricity prices are closely linked to natural gas prices." The chart below, prepared by ISO-NE, shows the close correlation between wholesale electricity and natural gas prices between for the past two decades:


ISO-NE reports that demand for electricity is the second main driver of the region's wholesale electricity prices, and that demand "is driven primarily by weather, as well as economic factors." The extent to which consumers rely on electricity-powered heating and air conditioning equipment means that peak demand is driven by weather. 

While New England's original electric system reached peak demand in winter, the region shifted to summer-peaking in the early 1990s due to increased air conditioner use and decreased reliance electric heating. The grid operator's records as of mid-2023 show that the all-time high winter peak of 22,818 MW occurred during a cold snap in January 2004, and the all-time peak demand of 28,130 MW occurred during an August 2006 heat wave. 

ISO-NE projects future growth in consumer demand for electricity and a shift back to a winter-peaking system by 2035, as beneficial electrification of the region's heating and transportation sectors add heat pumps and electric vehicles to the grid.